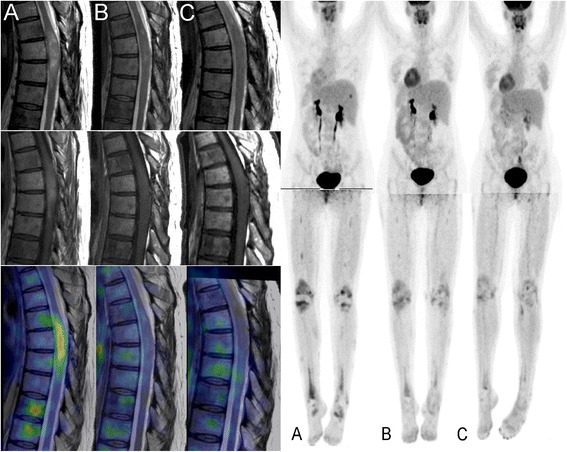
Figure 2.

Treatment response. Left panel: Sagittal imaging of the spinal cord tumor at the level of the 2nd-7th thoracic vertebrae by T2-weighted MRI (upper row), T1-weighted, gadolinium enhanced MRI (middle row) and fusion with FDG-PET (lower row) taken at baseline (A), one month (B) and three months (C) of vemurafenib therapy. There is gradual regression of the intramedullary tumor’s size, edema (T2 signal) and contrast-enhancement. PET shows complete disappearance of FDG uptake in the tumor and substantial reduction in the bodies of the 6th and 7th thoracic vertebrae. Right panel: whole body FDG-PET taken at the same time points showing gradual regression of hot-spots in the patient’s skeleton and in particular the lower limbs.
