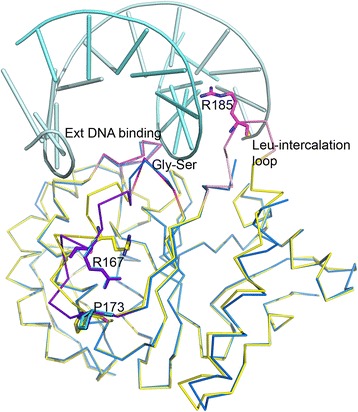
Fig. 3.

D4:DNA interactions. Comparison of the structures of D4 in free and DNA-bound states. Ribbon diagram showing superimposition of D4 subunits A and B (in marine and cyan) on D4 in the free form in yellow (4dof, chain A). The DNA is shown as cartoon (pale cyan) as bound to the A subunit in the complex. Areas important for DNA-interactions are highlighted on 4dof chains in magenta (Extended DNA binding loop, residues 126–132), red (Gly-Ser loop, residues 159–162) and rose (Leu intercalation loop, residues 180–187). The Leu-intercalation loop is on 4dof. Arg185 which replaces the conserved leucine residue is shown in stick model. The helix loop segment that shows large deviation (residues 164–174) is colored in violet. This region is critical for binding of A20 by D4. Residues Arg167 and Pro173 which play an important role in binding of A20 are shown as stick models and labeled
