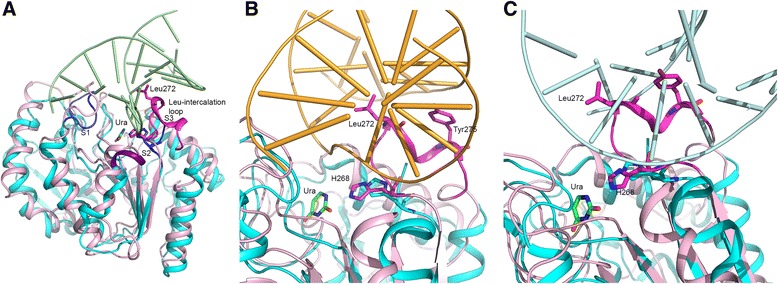
Fig. 8.

Comparison of D4:DNA complex with hUNG:DNA complex. a. Overall comparison. Structure of the A subunit of the D4:DNA complex (cyan) is superimposed on the structure of hUNG:DNA (1ssp, light pink). DNA chain from 1ssp is shown in cartoon drawing (pale green). Uracil molecule cleaved and bound at the uracil binding pocket in hUNG is shown in stick model (carbon in green). His181 of D4 and the corresponding His268 of hUNG are shown in stick models. Leu272 of the Leu-intercalation loop (magenta) in hUNG is also shown in magenta sticks. DNA-binding areas on D4 are colored darker: S1 site, residues 126–132, S2 site residues 159–162 and S3 site residues 180–187. The corresponding residue of Leu272 in D4 is disordered. b. Close up view 1. Close up view showing superimposition of D4 subunit A of D4:DNA complex (cyan) on hUNG:DNA complex structure (light magenta). DNA bound to hUNG is shown in cartoon (light orange). Uracil molecule (Ura) in hUNG uracil binding pocket is shown as stick model (carbon in green). Catalytic His268 of hUNG and the corresponding H181 of D4 are also shown in stick model. c. Close up view 2. Cartoon diagram shows superimposition of the hUNG chain (light magenta) from the DNA complex 1ssp on the D4 chain A (cyan) of the D4:DNA complex. DNA shown in cartoon model is from the D4:DNA complex (chain D, light cyan). Unless specified otherwise figures were generated using PyMOL (http://pymol.org/) [51]
