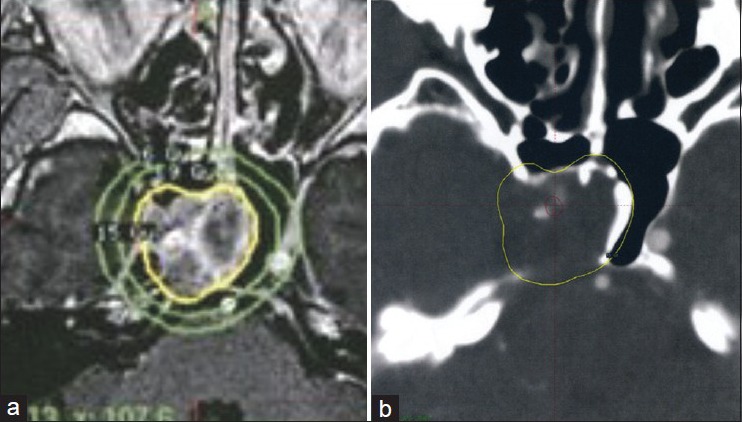
Figure 2.

(a) Dosimetry of the GKS procedure. The marginal dose to the tumor margin was 15 Gy at the 50% isodose curve. (b) Isodose lines on the dosimetry planning showing the dose received by the intracavernous segment of the ICA, retrospectively (red line = 20-22 Gy isodose line, yellow line = 15 Gy isodose line)
