Figure 3.

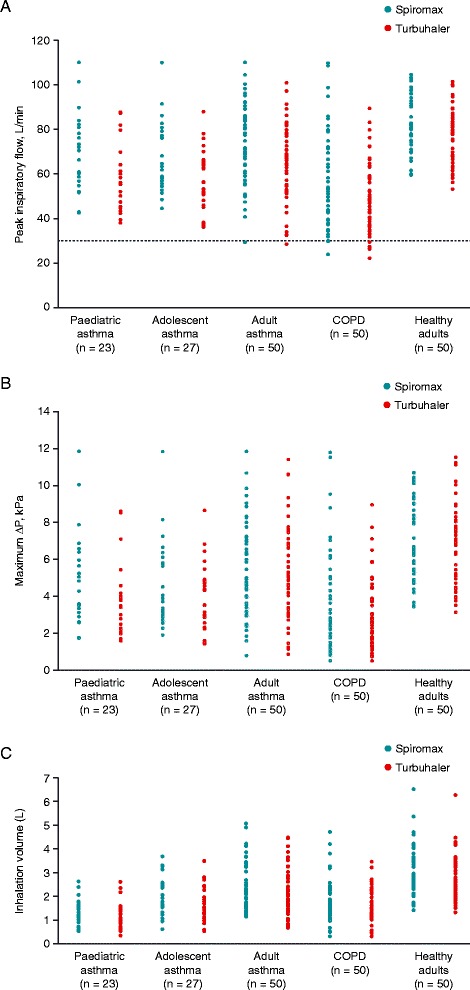
Individual peak inspiratory flow rates (A), maximum pressure change (ΔP) (B) and inhalation volume (C) before enhanced training. In graph (A), the horizontal dotted line represents 30 L/min (minimal flow for adequate drug delivery).

Individual peak inspiratory flow rates (A), maximum pressure change (ΔP) (B) and inhalation volume (C) before enhanced training. In graph (A), the horizontal dotted line represents 30 L/min (minimal flow for adequate drug delivery).