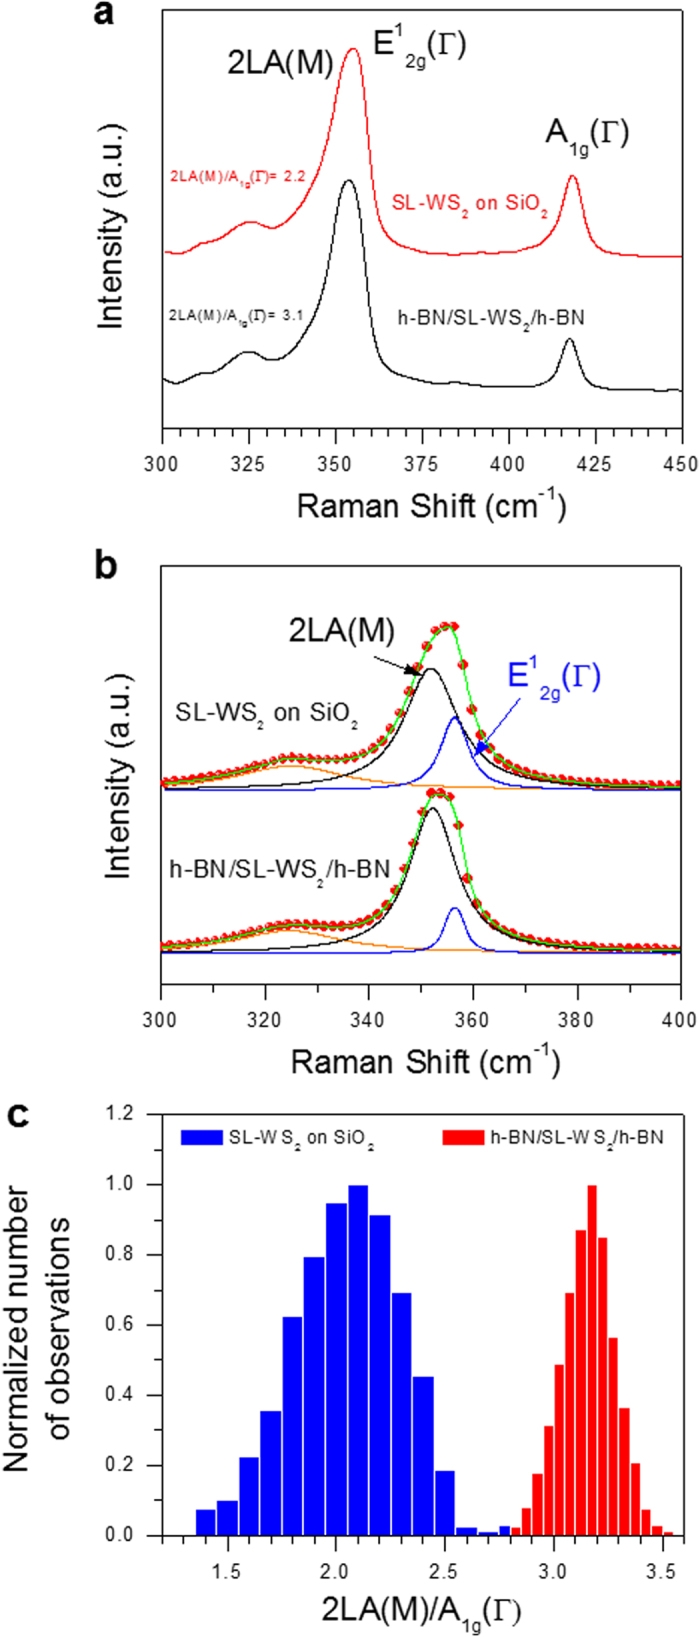
Figure 5. Raman spectra of WS2 films on different substrates.

(a) Raman spectra for SL-WS2 on SiO2 and h-BN/SL-WS2/h-BN. (b) Lorentzian fitting for E2g and 2LA(M) peaks. Red circles represent experimental data, while blue, black, and green lines represent E2g, 2LA(M), and combined peak fitting, respectively. (c) Statistical distribution of the Raman intensity ratio (I2LA(M)/IA1g) for SL-WS2 on SiO2 substrate, h-BN/SL-WS2/h-BN. The mean value of I2LA(M)/IA1g was 2.0 for SL-WS2 on SiO2 and 3.1 for h-BN/SL-WS2/h-BN.
