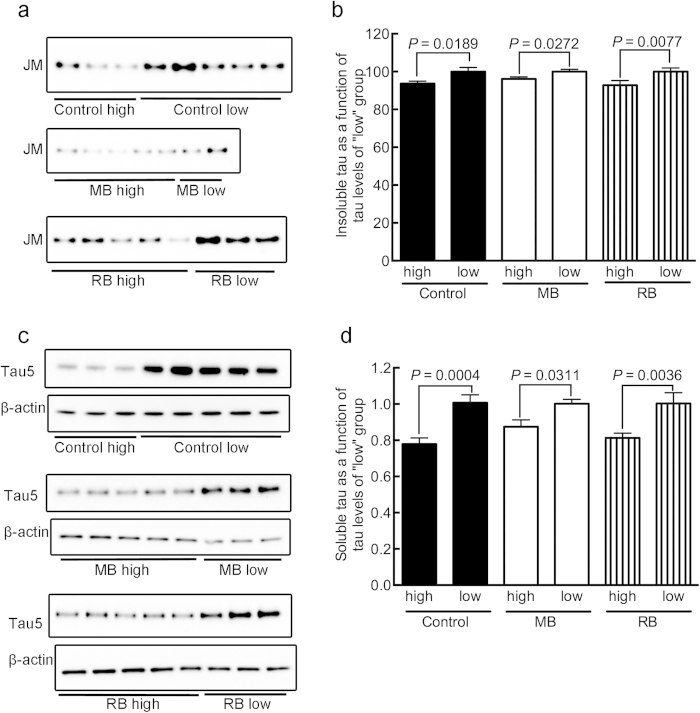
Figure 3. Climbing deficits in ELAV;hTau flies were correlated with the accumulation of insoluble and soluble tau.
Flies that climbed higher than 3 cm from the bottom of the vial (high) and flies that could not climb (low) were separated and counted before their heads were dissected for biochemical analysis. (a) Western blot showing JM immunoreactivity of sarkosyl-insoluble fractions from “high” and “low” climbing flies. (b) Quantification of JM immunoreactivity of sarkosyl-insoluble tau showing that control, MB-treated, and RB-treated flies that climbed higher than 3 cm had significantly less tau than the flies that could not climb above the 3 cm level in each group (control, P = 0.0189; MB-treated, P = 0.0272; and RB-treated, P = 0.0077). (c) Western blot showing tau5 and β-actin immunoreactivities of TBS-soluble fractions from “high” and “low” climbing flies. (d) Quantification of tau5 immunoreactivity of TBS-soluble tau showing that control, MB-treated, and RB-treated flies that climbed higher than 3 cm had significantly less tau than the flies that could not climb above the 3 cm level in each group (control, P = 0.0004; MB-treated, P = 0.0311; and RB-treated, P = 0.0036). In the biochemical analysis, data are means ±SEM of control (n = 16 for both “high” and “low” flies); MB-treated (n = 18 and n = 10 for “high” and “low” flies, respectively); and RB-treated (n = 21 and n = 10 for “high” and “low” flies, respectively). Note that the average of the “low” group was set to 100% for each treatment condition. Blots were cropped as shown in the figure within the rectangular box to represent the bands that were reactive to the pan-human tau antibodies at 65 kDa. Soluble tau level was normalized by the band intensity of β-actin used as a loading control. All the gels were run under the same experimental conditions. The full-length blots of the cropped blots are available in the Supplementary Figure S3.

