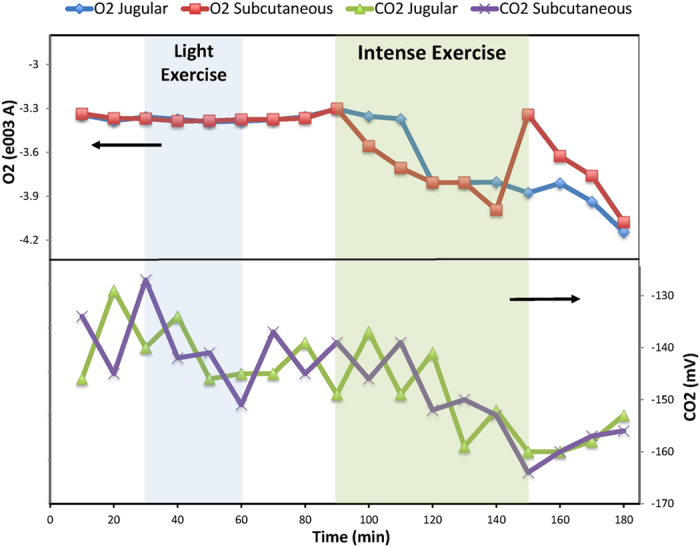
Figure 1.

Effect of light and intense exercise on oxygen and carbon dioxide levels in the blood and subcutaneous tissue. Areas shaded blue and green indicate light and intense exercise, respectively, and unshaded areas indicate periods of inactivity (rest or recovery). The top panel displays oxygen level changes and the bottom panel carbon dioxide changes in the dialysate. Arrows indicate y axis. Oxygen levels did not respond to light exercise but only during intense exercise. Carbon dioxide levels responded to both light and intense exercise, but showed highly unstable readings.
