
Fig. 2.
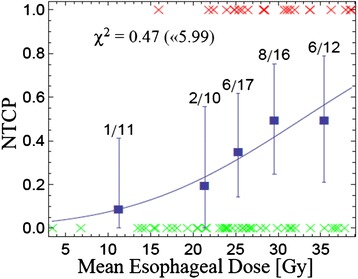
NTCP for AE ≥ grade 2 is shown as a function of mean esophageal dose (MED). Red x-symbols represent patients with AE ≥ grade 2, green x-symbols represent patients without toxicity. The actually observed AE rates are shown as bold squares in the centers of corresponding histogram bins (chosen to represent a comparable number of patients). Errors shown are binomial confidence intervals, χ 2 of the fit and the upper threshold according to Chi-square statistics (α = 5 %) are given for each model