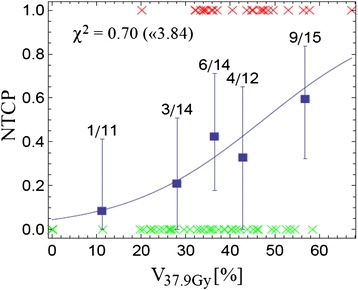
Fig. 4.

Cutoff dose logistic regression model of AE ≥ grade 2: NTCP based on the cutoff dose model for Dc = 37.9 Gy (this Dc showed the maximum for LL, see Fig. 3): the probability of AE ≥ grade 2 plotted as a function of the relative volume receiving ≥ 37.9 Gy
