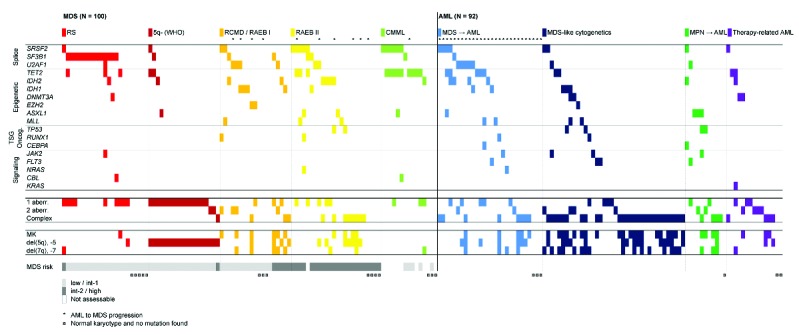
Figure 1.

Distribution of mutations and cytogenetic aberrations in 100 patient samples with myelodysplastic syndromes (MDS) and 92 samples with acute myeloid leukemia (AML). Each column represents one patient. The colors represent different subgroups of the diseases. *Denotes patients with MDS who subsequently progressed to AML and AML with a morphologically identified preceding MDS phase. ¤Denotes patients with normal karyotype and no mutation. aberr.: aberration; MK: monosomal karyotype; TSG: tumor suppressor gene.
