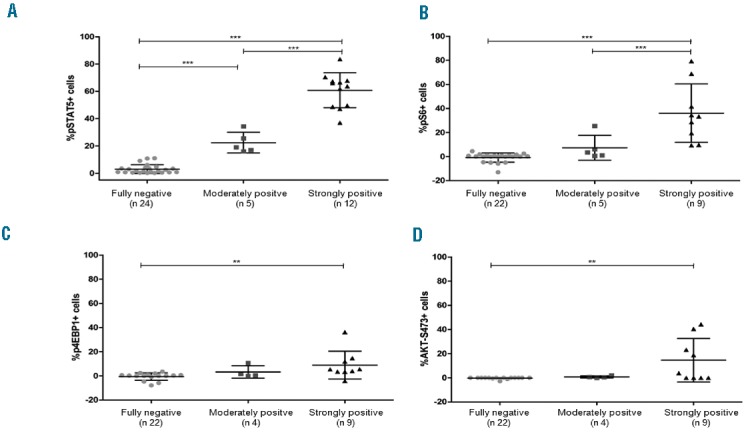
Figure 2.

TSLP-induced phosphoprotein responses in BCP-ALL patients according to TSLPR expression (fully negative, moderately positive, or strongly positive). Distribution of positive cells is represented as whiskers plot of 5th and 95th percentile with means and standard deviations. Statistical significance among groups was determined by one-way ANOVA analysis of variance followed by post hoc Bonferroni’s multiple comparison test (*P<0.05, **P<0.01, ***P<0.001). (A) Shows pSTAT5 response (n 41); (B), (C), and (D) show TSLP-induced pS6, p4EBP1 and pAKT expression (n 36, 35, and 35, respectively). All groups were compared, but only those with statistical significance are indicated by stars and horizontal bars. Data were normalized to the basal phosphorylation level of each phosphoprotein.
