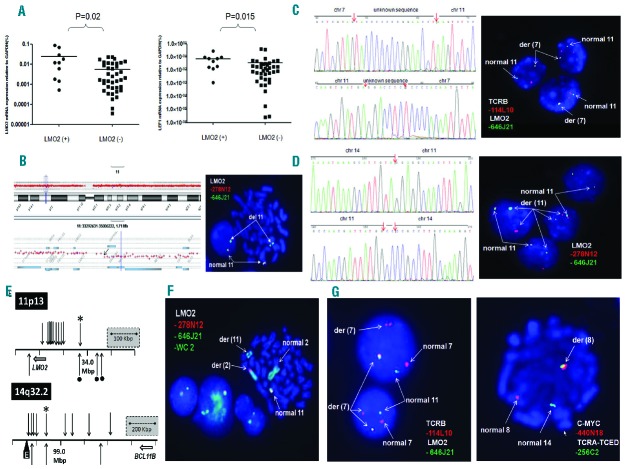
Figure 1.
Integrative genomic and transcriptional analyses of LMO2 rearrangements in T-ALL patients. (A) The q(uantitative)R(everse)Transcription-PCR results (left) showed that LMO2 transcripts were significantly higher in cases with LMO2 rearrangements (P=0.02) than without. Meanwhile, LEF1 transcripts (right) were significantly higher in cases with LMO2 rearrangements (P=0.015) than without. (B) FISH with RP11-646J21 (green) and RP11-278N12 (red) probes and array-CGH analysis revealed a 475 Kbp of del(11p13p13) including the upstream LMO2 region in T-ALL samples. (C) Whole genome sequencing (WGS) was performed using the Illumina Hiseq 2500 system (Agilent, Santa Clara, CA, USA) according to the manufacturer’s protocol. We identified a fusion between 11p13 (33,856,828 bp) with 7q34 (142,494,025 bp) in case 6 with normal karyotype (left). Dual color FISH experiments with probes RP11-114L10 (TCRB, red) and RP11-646J21 (LMO2, green) confirmed the balanced translocation between 7q34 and 11p13 (right). (D) WGS identified a fusion between 11p13 (33,957,035 bp) and 14q32 (98,842,615 bp) in case 10 with complex karyotype (left). Dual color FISH experiments with RP11-646J21 (green) and RP11-278N12 (red) probes confirmed the involvement of LMO2 in this patient (right). (E) LMO2 and BCL11B breakpoints in T-ALL. Diagram shows distribution of translocation breakpoints at chromosome 11p13 and 14q32.2 previously reported in T-ALL.7,13 Arrows indicate patient breakpoints above and cell lines below co-ordinate plots. The t(7;11)(q35;q13) and t(11;14)(q13;q32) breakpoints mapped in this report are indicated by a diamond and asterisk, respectively. The black wedge (“E”) shows a remote downstream enhancer region characterized by us previously,13 which coincides with the distal BCL11B breakpoint cluster region boundary. Note placement (right figure) of the LMO2-BCL11B breakpoint amid other BCL11B partners, TLX3 and NKX2-5, consistent with analogous activation mechanisms for all three oncogene targets. Note also contrasting non-canonical placement (left figure) of the LMO2-BCL11B patient breakpoint upstream of LMO2 breakpoints all of which involved TCR loci. The same patient breakpoint lay instead amid other non-TCR cell-line breakpoints (bullets), all located more distally upstream of LMO2, implying mechanistic differences between the oncogene activation mechanisms of TCR and non-TCR LMO2 translocations. (F) FISH with RP11-646J21 (green) and RP11-278N12 (red) probes and whole chromosome painting probe for chromosome 2 revealed a translocation between LMO2 with the short arm of chromosome 2 in case 15 with 47,XY,t(1;1)(p33;q41),t(2;11)(p15;p15),i(7q),+12[10]. (G) FISH analysis revealed simultaneous involvement of TCRB and TCRA-TCRD in case 17. Dual color FISH experiments with probes RP11-114L10 (TCRB, red) and RP11-646J21 (LMO2, green) confirmed the rearrangement between 7q34 and 11p13 (left). Meanwhile, FISH with probes RP11-440N18 (MYC, red) and RP11-256C2 (TCRA-D, green) confirmed the rearrangement between 8q24 and 14q11 (right).

