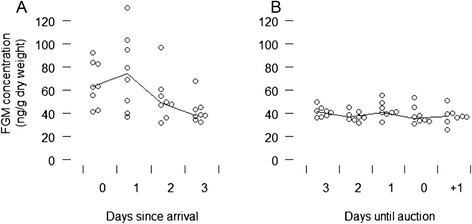
Fig. 2.

Faecal glucocorticoid metabolite (FGM) concentrations of consigning farms (n = 8) during the adaptation (A) and auction (B) phase. Circles represent median FGM concentrations for horses from different farms on each day. Lines connect daily medians of the 8 farm median FGM values. Day “+1” in panel B indicates the day post-auction for which faecal samples were obtained from half of the study’s horses. With a gut passage time of approximately 24 h, FGM values reflect physiological stress responses to stimuli experienced on the previous day
