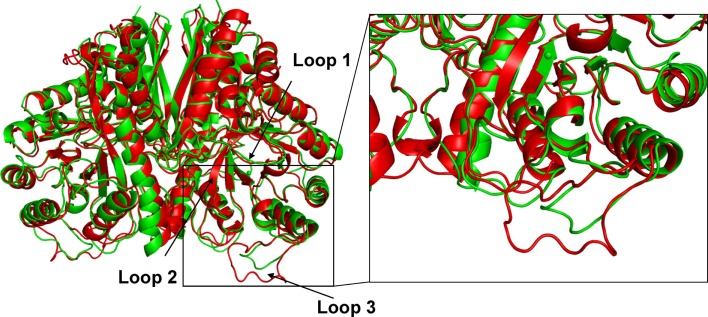
Figure 3.
Comparison of crystal structure of C. aurantiacus and Saccharomyces cerevisiae enolase. Difference in the secondary-structure elements of C. aurantiacus enolase (in green) and S. cerevisiae enolase (1EBH; in red). The two structures are superimposed and the difference in the loop with residues 189–207 and L3 loop (residues 247–268) are shown. Insert shows close-up view of the loop L3.

