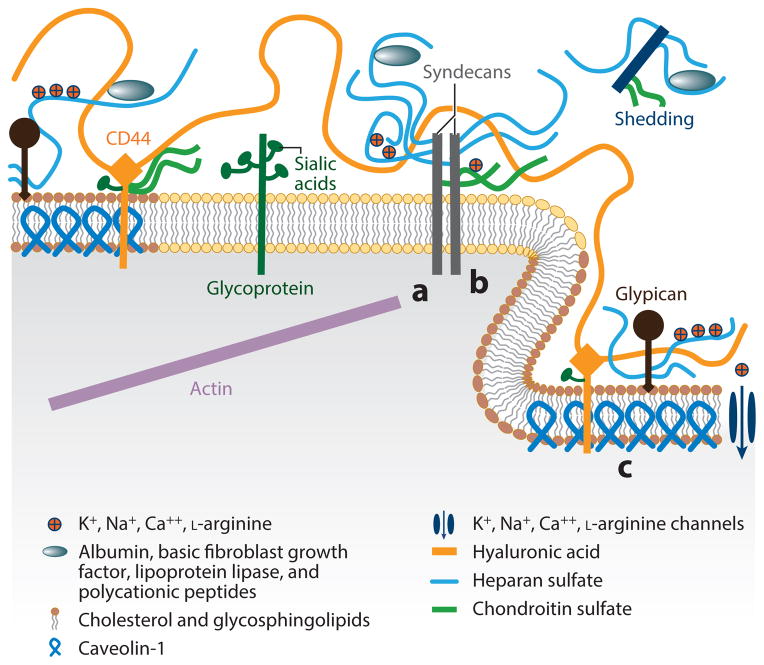
Figure 2.
Schematic diagram showing the components and spatial organization of the endothelial glycocalyx. In the diagram, a denotes the region where the cytoplasmic tail of syndecan links to the actin cytoskeleton, b indicates oligomerization of syndecans, and c labels caveolin protein within a caveola. All other components are labeled in the diagram. (Figure adapted with permission from 11.)

