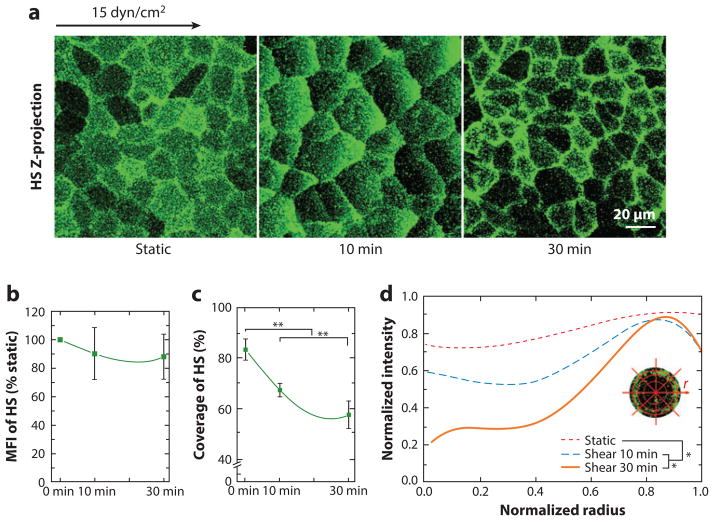
Figure 4.
Redistribution of heparan sulfate (HS) under shear stress. (a) Representative immunofluorescent images of an HS-labeled rat fat pad endothelial cell (RFPEC) under static and shear stress conditions. Respective changes in the (b) mean fluorescence intensity (MFI), (c) coverage, and (d) average radial profile of HS. The zero-radius represents the center of the cell. Significant difference: *P < 0.05; **P < 0.01. (Figure adapted with permission from 63.)

