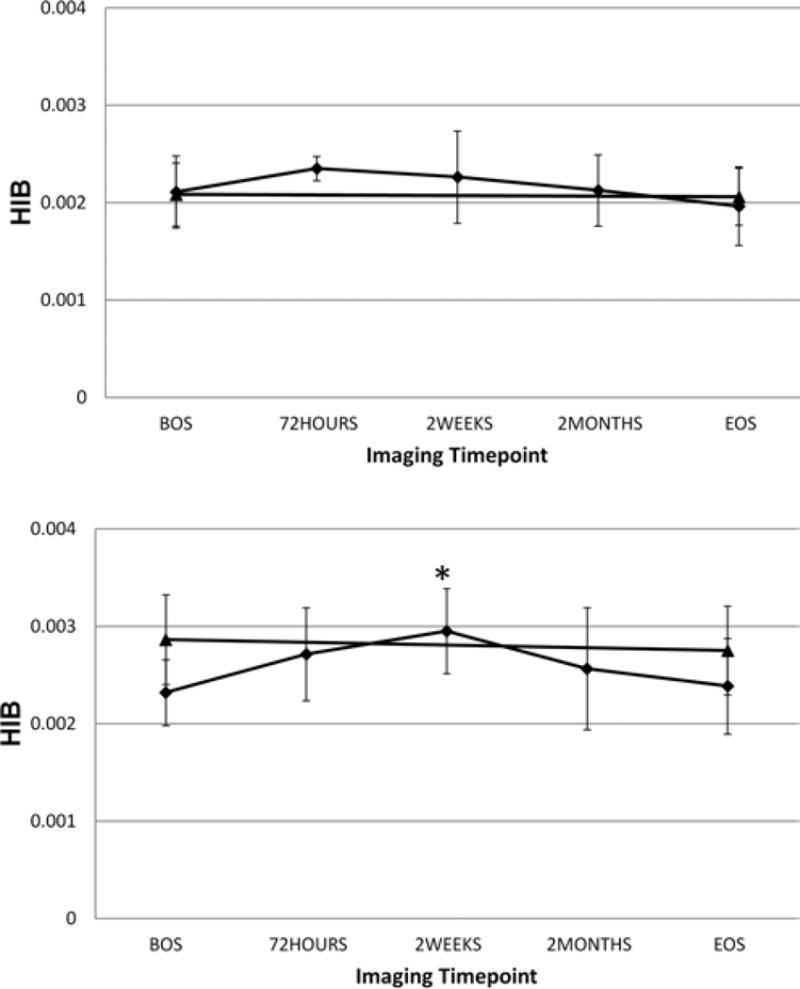
Fig. 5.

Graphs showing the mean ± SD for the CN (diamonds) and all NC (triangles) subjects regardless of previous concussion status for the female subjects (upper) and the male subjects (lower). The BOS and EOS data are almost identical for NC and CN cohorts for the female subjects, but the mean BOS and EOS HIB values for the NC group are higher, except at two weeks, than either of the CN time points Q13:higher except at 2 weeks; do you mean “either” as edited instead of “all”?? for the male subjects. The asterisk in the lower panel denotes a statistically significant difference between the 2-week time point data for the CN male subjects and their BOS mean HIB value.
