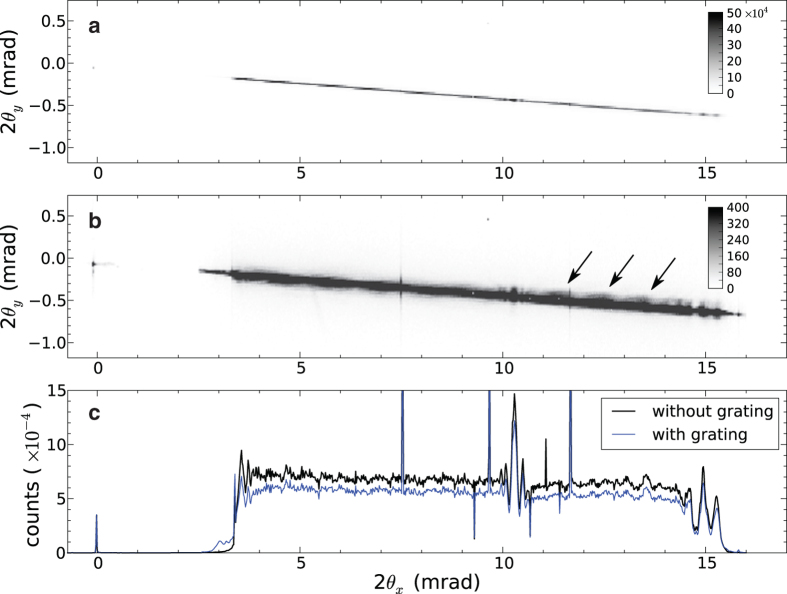
Figure 3.
The far-field diffraction of the lens measured without any sample in place (a), and with the test grating in the beam 80 μm out of focus (b). Also shown in (c) are line-outs of intensity formed by integrating over detector columns (in y) without (black) and with (blue) the sample in place.

