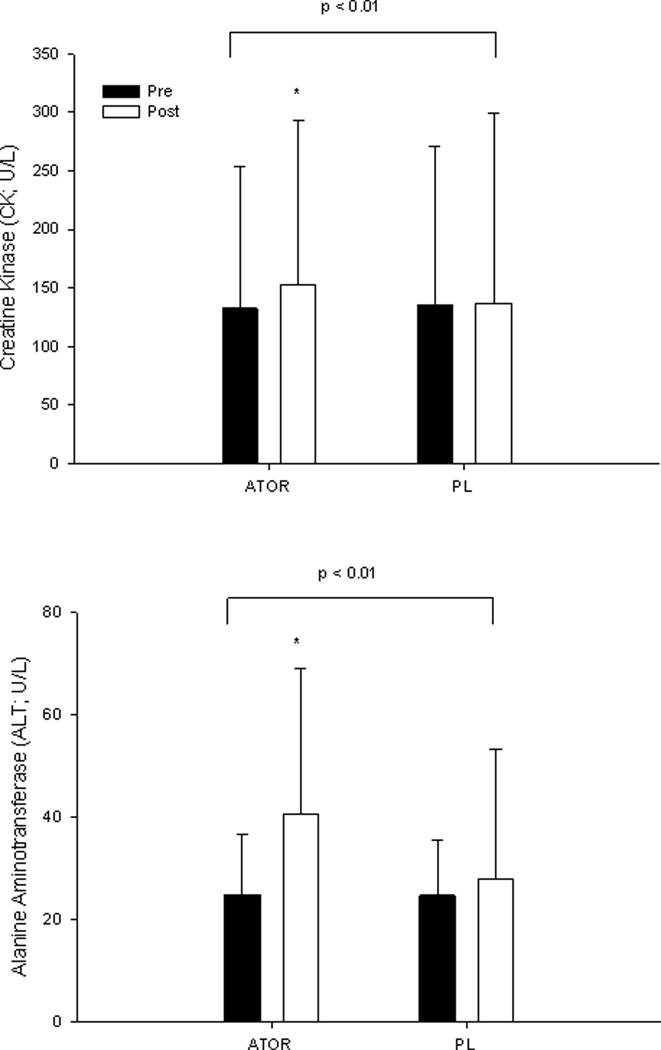
Figure 2.
Group mean ± SD of creatine kinase (CK; top) and alanine aminotransferase (ALT; bottom) before (Pre) and after (Post) 6 months of atorvastatin (ATOR) or placebo (PL) treatment with brackets indicating the p value for group-by-time interaction. *Significant difference between groups within a timepoint at p <0.05.

