
Figure 2. Proteasome-substrate interaction kinetics by the SM method.
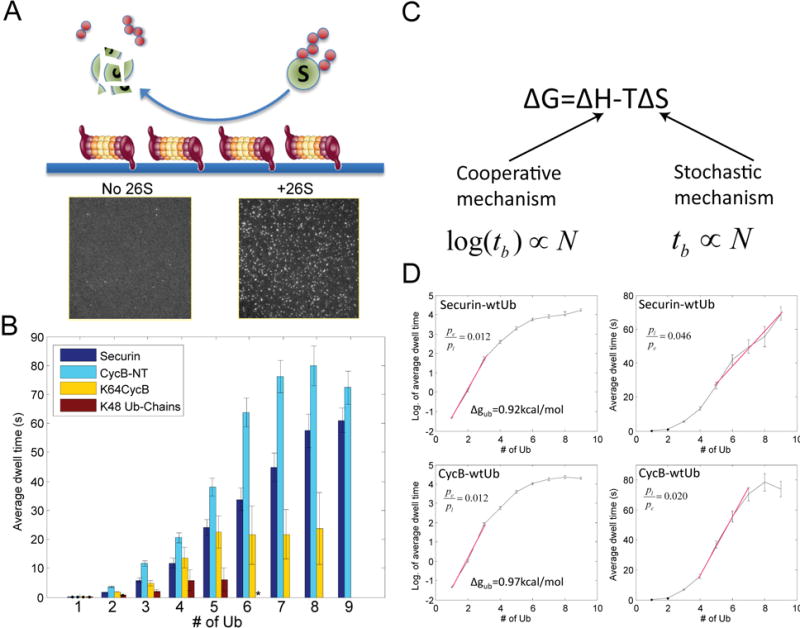
A. Schematics showing the experimental design, where purified 26S proteasome was immobilized on passivated coverslip using anti-20S antibody. Ubiquitin was fluorescently labeled and conjugated to substrates in solution. Sample pictures capture ubiquitin signals on the surface with either 26S proteasome (+26S) or antibody only (no 26S). B. The average dwell time on the proteasome for different substrates (or free ub-chain) with X-number of conjugated ubiquitin, measured by the SM method. The distributions of individual dwell times are shown in Fig. S15. Errorbars represent standard deviation of the mean. ‘*’: data for Ub-chain from 6~9 is not shown due to insufficient events. C. Cooperative and stochastic mechanisms affect binding enthalpy and entropy respectively. By each mechanism, the expected relationship between dwell time tb and the number of ubiquitins N is shown below. D. Dwell time on the proteasome(right), or its logarithm(left), for securin and cyclinB vs. the number of conjugated ubiquitins. The red line shows a linear fitting. The ratio of p-values by fitting the red segment (in linear scale) with either a linear model (pl) or an exponential model (pe) is shown. Δgub is the binding free energy per ubiquitin on the proteasome, calculated from the slope of the binding curve.