
Fig. 2.
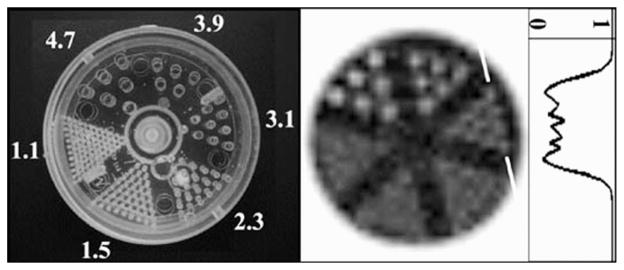
(Left) Photograph of the mini-rod phantom, with diameters labeled (in mm), with a pitch equal to twice their diameter. (Middle) OSEM reconstructed mini-rod data (8 subsets, 20 iterations, 2.5-mm voxels, 5 summed slices to reduce noise, correction for COR partial pixel shift) acquired with 4.4-cm ROR. (Right) Profile (one-pixel wide) drawn through the 3.1-mm rods at edge, as indicated. Darker grayscale values indicate areas where activity is present (normalized to 1 in this case); white areas (i.e., the rods) are cold.