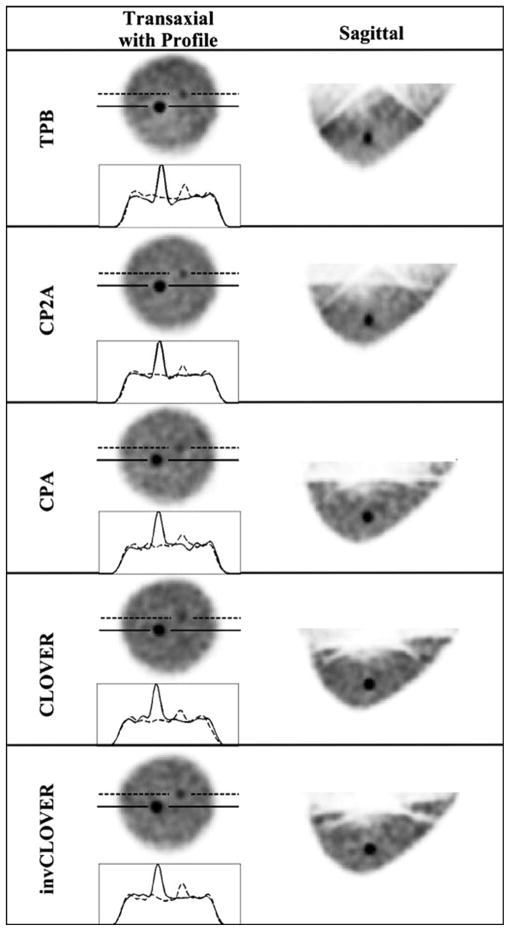
Fig. 9.
OSEM reconstructed data (8 subsets, second iteration smoothed with Hann filter shown) from the 935 ml breast data, for each labeled orbit, with a 9.8:1 lesion:breast radionuclide concentration ratio. Solid line in transaxial slice and profile is through the 8-mm lesion, and the dashed line is through the 5-mm lesion. Note that incomplete sampling artifacts from reconstructed data seen with the TPB orbit sagittal views are reduced with the more complex orbits that improve sampling, similar to results shown in [20] and [21].

