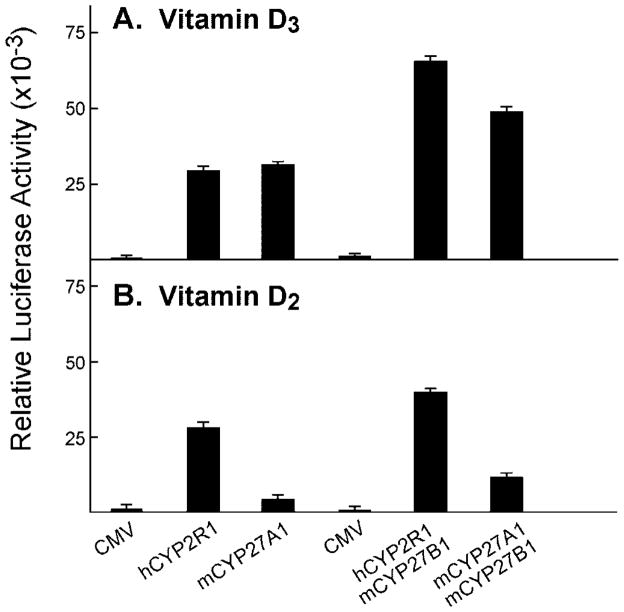
Fig. 6. Activation of vitamin D3 and vitamin D2 by microsomal versus mitochondrial P450 enzymes.
Vectors specifying the VDR/VDRE-luciferase reporter system were introduced into HEK 293 cells grown in 60-mm dishes together with the indicated expression plasmids encoding no protein (CMV) or various vitamin D hydroxylases. Relative luciferase enzyme activities were measured 16–20 h later. The means ± S.E. were calculated for each plasmid or combination of plasmids analyzed in triplicate. A, the concentration of vitamin D3 in the medium of dishes transfected with the CMV, hCYP2R1, and mCYP27A1 plasmids (left three histogram bars) was 0.5 μM, and the concentration in the medium of dishes transfected with CMV, hCYP2R1 + mCYP27B1, and mCYP27A1 + mCYP27B1 plasmids (right three histogram bars) was 0.25 μM. B, the concentration of vitamin D2 in the medium of dishes transfected with the CMV, hCYP2R1, and mCYP27A1 plasmids (left three histogram bars) was 0.5 μM, and that in the medium of dishes transfected with CMV, hCYP2R1 + mCYP27B1, and mCYP27A1 + mCYP27B1 plasmids (right three histogram bars) was 0.1 μM.

