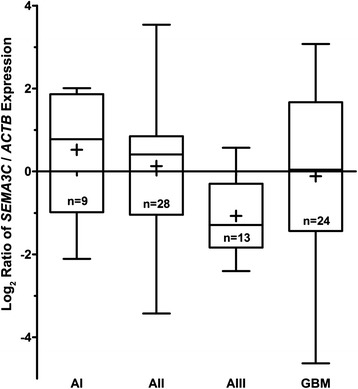
Fig. 2.

Relative SEMA3C mRNA expression in different malignancy grade astrocytic gliomas. The markings of malignancy grade are the same as in Fig. 1. Real-time PCR data shown as log2 of fold change of SEMA3C/ACTB mRNA expression. The line inside box represent median, the plus symbol (+) inside the box represent the mean, and the lower and upper edges of the boxes represent 25th an 75th percentile, respectively. Upper and lower lines outside the box represent minimum and maximum values (error bars)
