Fig. 4.

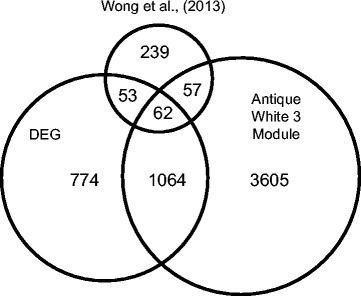
Venn diagram of genes identified to be associated with line differences. Genes comprise those found in edgeR analysis (DEG), WGCNA analysis (Antique White 3 Module), and anxiolytic drug treatment (Wong et al., (2013))

Venn diagram of genes identified to be associated with line differences. Genes comprise those found in edgeR analysis (DEG), WGCNA analysis (Antique White 3 Module), and anxiolytic drug treatment (Wong et al., (2013))