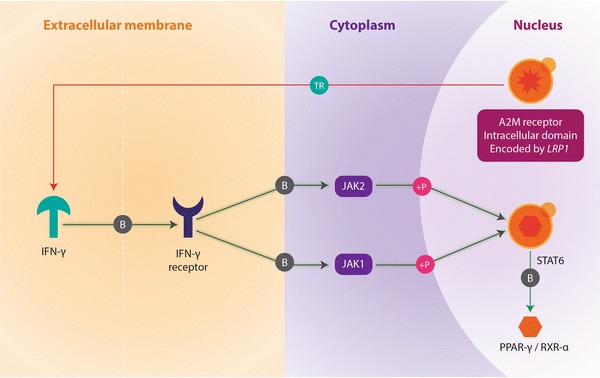
Figure 2.

Network analysis of candidate genes involving the A2M receptor intracellular domain. In this network, the effect of the A2M receptor (encoded by LRP1) intracellular domain upon IFN-gamma is illustrated. Locations of relevant proteins in this network are shown in the nucleus, cytoplasm and extracellular membrane respectively. The mechanistic nature of the protein interactions in the network are as follows: TR transcriptional regulation, B binding, P phosphorylation. The downstream effects exhibited by the protein–protein interactions between a given set of nodes are represented by the following colours on each of the mechanism symbols: green inhibition (by transcriptional regulation), grey activation (by binding), pink activation (by phosphorylation). The A2M receptor and the STAT6 transcription factor are highlighted with a yellow dot, showing that they are part of the candidate gene list used as an input source for the network-building algorithm implemented to generate this biological network.
