
Fig 1. Analysis of fibrosis in wild-type and NS3/4A-Tg mice after CCl4 administration.
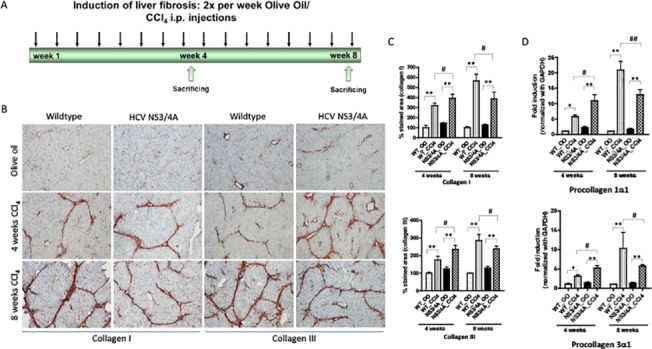
(A) Regimen of liver fibrosis induction (sacrificed after 4-weeks (intermediate fibrosis) and 8-weeks (chronic fibrosis) of CCl4). (B) Representative photomicrographs and (C) quantitative analysis of collagen-I and collagen-III stained liver sections of 4-weeks and 8-weeks olive-oil treated and CCl4-treated wild-type and NS/4A-Tg mice. Scale bars, 200μm. (D) mRNA expression of procollagen-1α1 and -3α1 (normalized with GAPDH) in the livers of wild-type and NS3/4A-Tg. For quantitative and mRNA analysis, groups were normalized to olive-oil treated wild-type mice. Bars represent mean ± SEM of n = 5. *p<0.05; **p<0.01; #p<0.05.