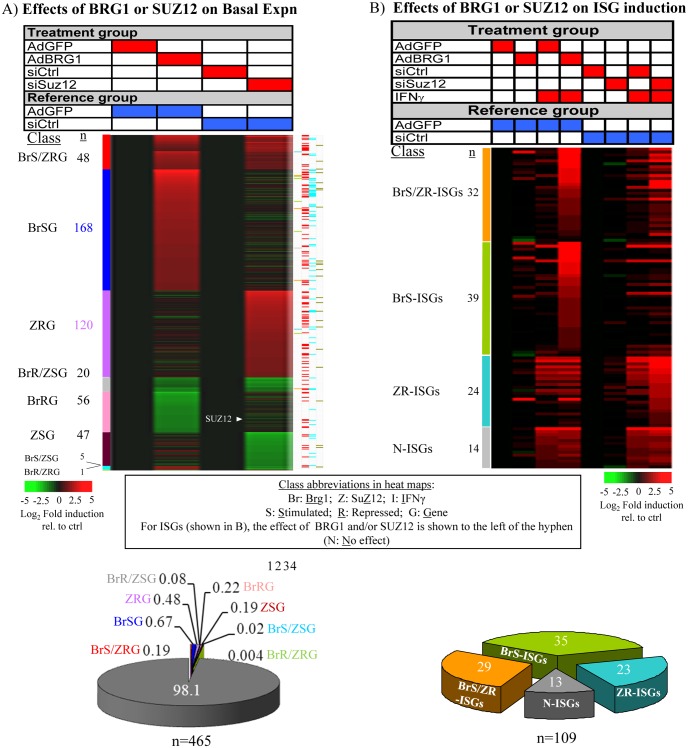
Fig 1. BRG1 and PRC2 regulate most ISGs.
Microarrays were performed with RNA from SW-13 cells to assess the effect of BRG1-reconstitution or SUZ12 knockdown on basal expression of all genes (A, 465 affected genes) or IFNγ responsiveness (B, 109 ISGs). Treatments are indicated in red and blue above each heatmap, gene classes are indicated by colored bars to the left of each heatmap, and the pie graphs summarize the % of genes in each class (In (A) grey = unaffected genes). An additional chart to the right of the heatmap in (A) classifies genes based on: 1. IFNγ responsiveness (ISGs = 12), or GO terms: 2. Development (n = 118); 3. Cell signalling (n = 64); 4. Cell migration (n = 24). Gene Class Abbreviations: Expn: Expression; Br: Brg1, Z: Suz12; S: Stimulated; R: Repressed; I: Interferon-γ; G: Gene.

