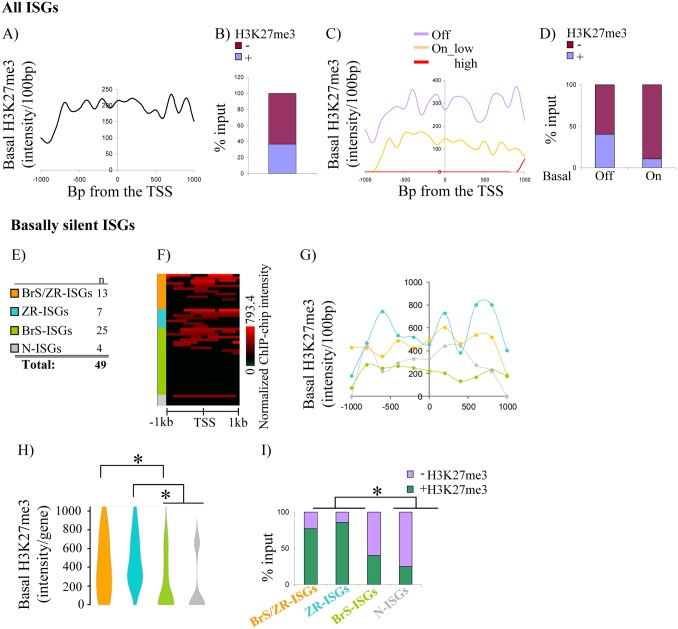
Fig 2. PRC2 epigenetic signature is common at ISG promoters.
Genome-wide ChIP-chip data was used to assess H3K27me3 levels at ISG promoters. (A) ChIP-chip signal intensity per 100 bp bins within +/-5 kb of the TSS of all 109 ISGs defined in Fig 1B. (B) Percentage of H3K27me3 positive and negative ISG promoters. (C) ChIP-chip signal intensity as in (A) but grouped according to ISG basal expression. (D) Histogram of the percentage of H3K27me3 positive and negative ISGs in relation to their basal gene expression. (E) Color code of basally silent ISGs analyzed in (F)-(H). (F) Heatmap shows basal H3K27me3 ChIP-chip signal within +/-1 kb of the TSS of the indicated basally silent ISG classes. (G) ChIP-chip signal intensity per 100 bp bins within +/- 1kb of the TSS of basally silent ISGs. (H) Violin plot shows the level of the average ChIP-chip signal. Asterisks indicate significant difference (P < 0.05, Mann Whitney test) between the indicated groups. (I) Histogram shows the percentage of H3K27me3 positive promoters in each indicated ISG class. *: significantly higher % of H3K27me3 positive ISGs between the indicated groups (P < 0.05, Fisher exact test). Gene Class Abbreviations: Br: Brg1, Z: Suz12; S: Stimulated; R: Repressed; I: Interferon-γ; G: Gene.

