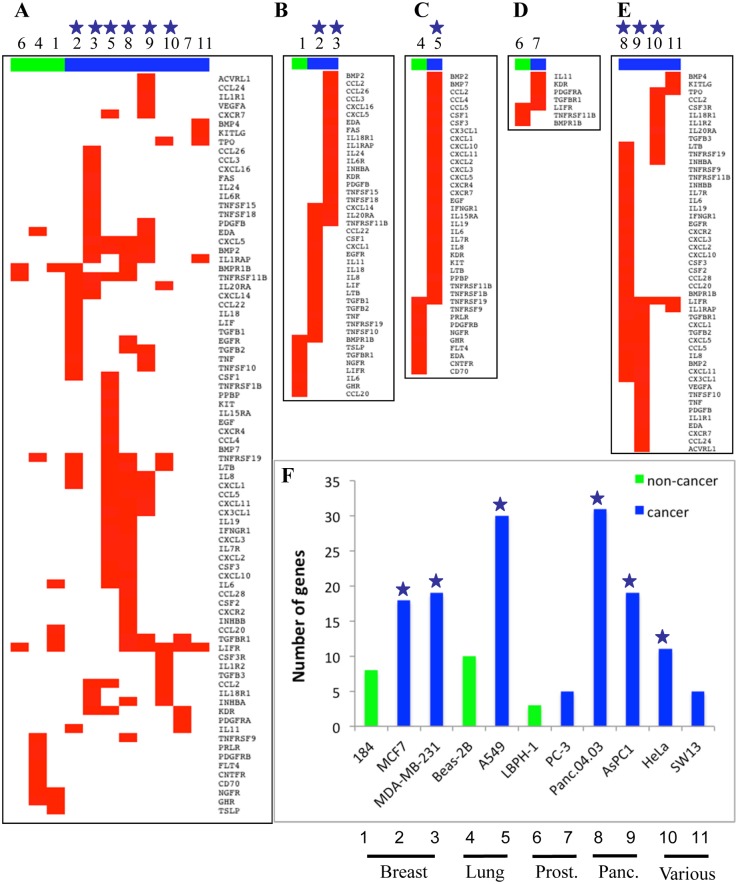
Fig 5. Distinct siSUZ12 induced CCRI pathway genes in cancer and non-cancer cell lines.
A. Heatmap of CCRI genes significantly induced by siSUZ12 (Differential Probability > 0.9) in 11 cell lines (non-cancer green, cancer blue). For cell line names corresponding to each number see (F). Blue stars in this and subsequent panels indicate cell lines in which the CCRI pathway was significantly enriched according to GSEA. B-E Heatmaps of subsets of the data in (A) separated by tissue type: B. Breast (184 non-cancer vs. MCF7 and MDA-MB-231 cancer), C. Lung (Beas-2B non-cancer vs. A549 cancer), D. Prostate (BPH-1 non-cancer vs. PC-3 cancer), and E. Another 4 cancer cell lines of pancreatic (Panc.04.03 and AsPC1), cervical (HeLa) and adrenocortical (SW-13) origin. F. Frequency of induced CCRI genes across all 271 CCRI genes in each cell line.

