
FIGURE 1.
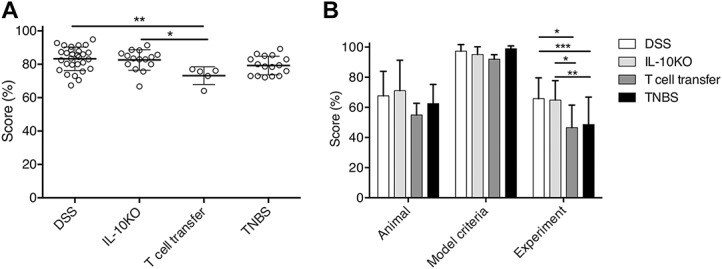
A, Overall scores (percent criteria reported) for the quality of methods reporting for each colitis model included in this review. The T cell transfer model scored significantly lower than DSS (P ≤ 0.01) and IL-10−/− (P ≤ 0.05) colitis models. n = 29 (DSS), 15 (IL-10−/−), 5 (T cell transfer), and 16 (TNBS). Analysis by two-way ANOVA. B, Methods reporting quality (percent criteria reported) for each of the 3 subsections of the quality reporting checklist. Criteria relating to the model subsection scored higher than the animal and experimental design subsections. Within the experimental design subsection, DSS and IL-10−/− scored significantly higher than both T cell transfer (P ≤ 0.05) and TNBS (P ≤ 0.001 and P ≤ 0.01, respectively) colitis models. n = 29 (DSS), 15 (IL-10−/−), 5 (T cell transfer), and 16 (TNBS). Analysis by two-way ANOVA. ANOVA, analysis of variance.