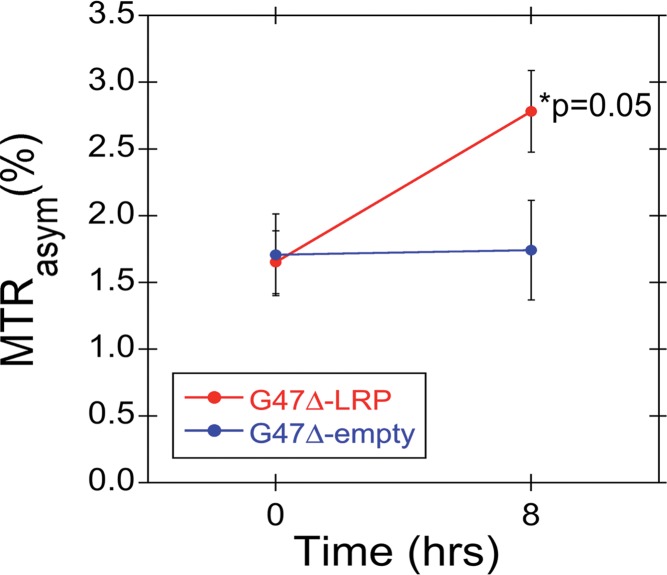
Figure 3a:
Graphs show the change in MTRasym after intratumoral injection of G47Δ-LRP in vivo. (a) Graph shows the mean MTRasym (± standard error) for G47Δ-LRP (n = 7) and G47Δ–empty virus (n = 6) before and 8 hours after virus injection. MTRasym increased significantly (P = .05) from 1.7% ± 0.2 (previrus injection) to 2.8% ± 0.3 (postvirus injection) in tumors treated with G47Δ-LRP. No change in MTRasym was observed in tumors treated with G47Δ–empty virus (MTRasym of 1.7% ± 0.3 previrus injection and 1.7% ± 0.4 postvirus injection). (b) The bars of the graph indicate the mean of the MTRasym difference (ΔMTRasym) between the two time points (previrus injection and 8–10 hours postvirus injection) for each virus with a significant (P = .02) increase of 1.1% ± 0.3 observed for G47Δ-LRP–infected tumors and no increase for G47Δ–empty virus–infected tumors (0.0% ± 0.2). CNTL = control.

