Figure 4:
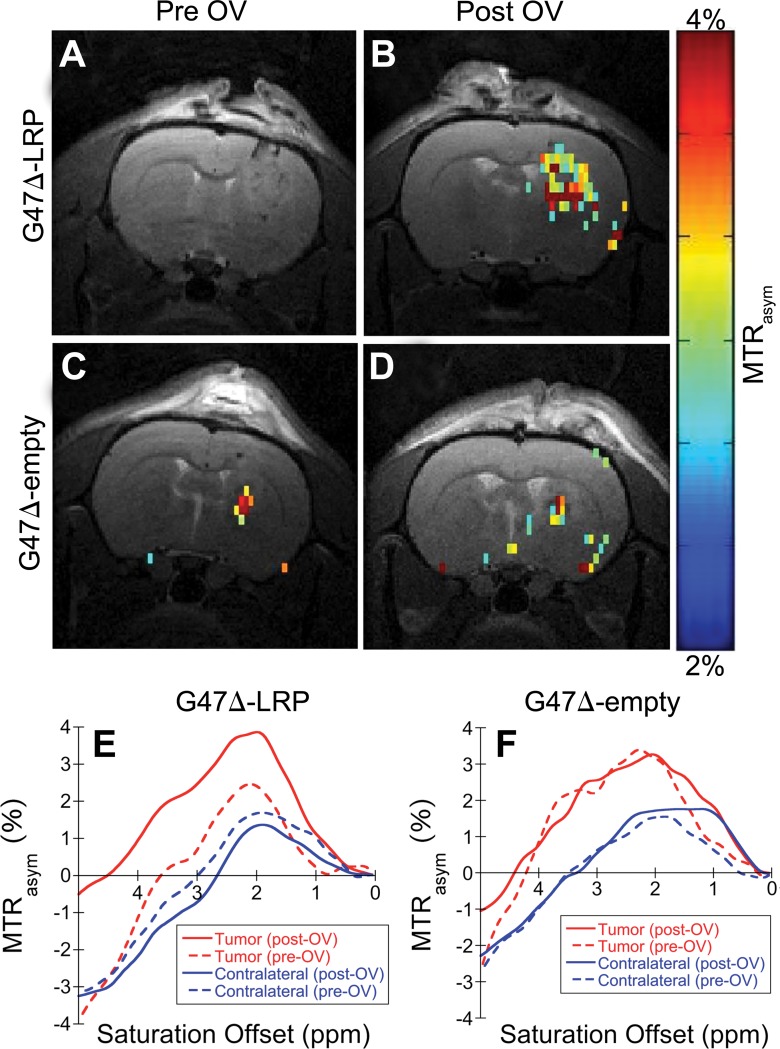
Images depict the overlay of representative MTRasym maps onto T2-weighted anatomic images. A–D, Representative MTRasym maps (color scale) acquired with a saturation frequency offset of 3.6 ppm and overlaid onto the associated T2-weighted (gray-scale) images obtained, A, C, before and, B, D, 8 hours after injection of, B, G47Δ-LRP and, D, G47Δ–empty virus. A significant increase in MTRasym is observed after virus injection for, B, the G47Δ-LRP virus but not, D, the G47Δ–empty virus. E, F, Plots for the MTRasym as a function of the saturation frequency offset for tumor (red lines) and contralateral hemisphere (blue lines) ROIs acquired before (dashed lines) and after (solid lines) injection of, E, G47Δ-LRP and, F, G47Δ–empty virus. A significant increase in MTRasym profile after virus injection is only observed for the tumor ROI of the G47Δ-LRP–infected tumor. No significant differences are observed between previrus injections and postvirus injections for contralateral tissue ROIs or the tumor ROI of the G47Δ–empty–infected tumor. OV = oncolytic virus.

