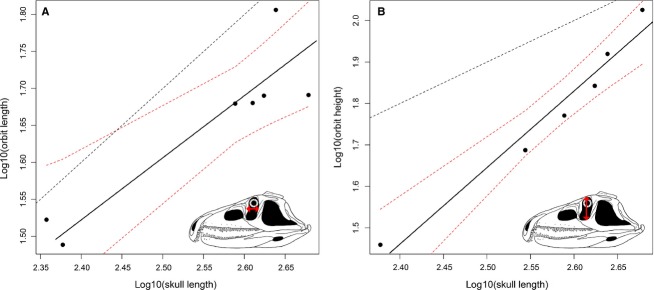
Fig 7.

Bivariate plots showing the possible negative allometric trend of (A) the length of the orbit and (B) the positive allometric trend of the height of the orbit. Dotted lines show the limits of the 90% confidence intervals and a line with a slope equal to 1, respectively.
