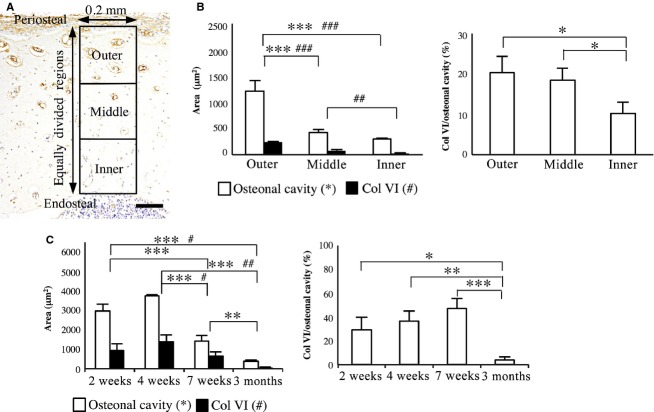
Fig 3.
Analysis of the osteonal cavity area and Col VI-immunoreactive area. (A) Col VI-immunohistochemistry, illustrating the equally divided three regions of the cortical bone for the analysis. Scale bar: 100 μm. (B) The osteonal cavity area, Col VI-immunoreactive area (left panel) and the percentage of Col VI-immunoreactive area to the osteonal cavity area (right panel) in outer, middle, and inner region at 7 weeks. (C) The osteonal cavity area, Col VI-immunoreactive area and the percentage of the Col VI-immunoreactive area to the osteonal cavity area in the upper cortical regions at 2, 4, 7 weeks and 3 months. Data represent mean ± SD. Significant differences were analyzed by one-way anova and Tukey post hoc test (*,#P < 0.05; **,##P < 0.01; ***,###P < 0.001).

