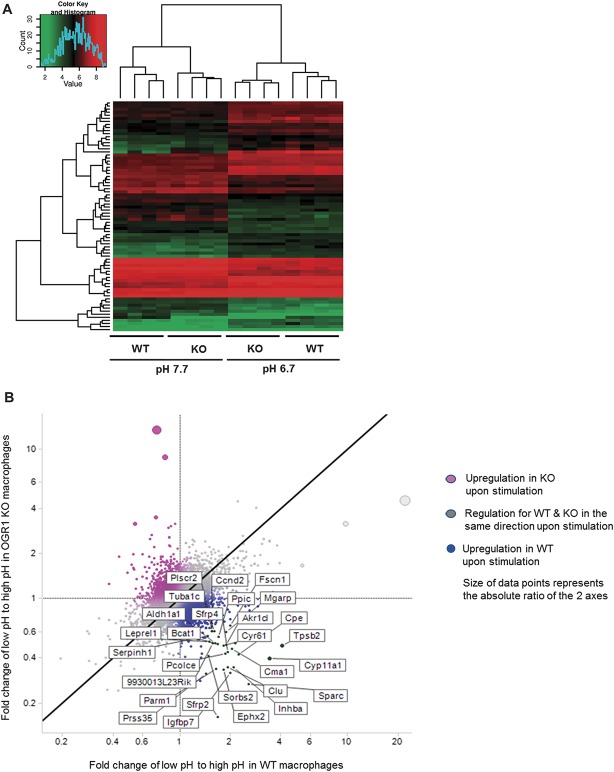
FIGURE 6.
Global gene expression of acid response of mouse macrophages. A, Top 100 genes from the whole-transcript microarray analysis of acid response (pH 6.7) of WT and Ogr1 KO murine macrophages. Control condition, pH 7.7 is shown on the left. Changes in gene expression within each comparison are represented as log2-transformed fold changes (≥2.0-absolute fold-change, P < 0.05 significance). B, Differentially expressed genes for acid response in WT and OGR1 KO macrophages. Fold changes in low to high pH shift of OGR1 KO macrophages are depicted on y-axis and fold changes low to high pH WT macrophages are shown on the x-axis. The highest ranking differentially expressed genes in the acid response of WT mouse macrophages are shown in the lower right quadrant of the scatter plot, and the upper left quadrant shows the highest ranking differentially expressed genes in the acid response of OGR1 KO mouse macrophages.

