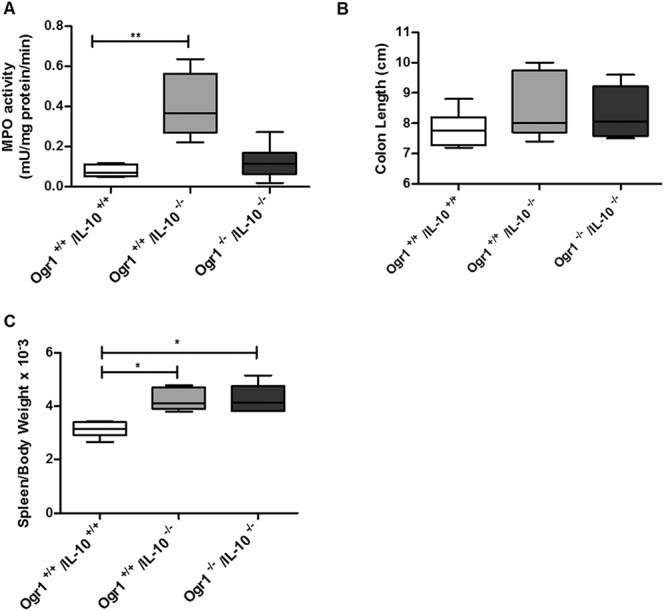
FIGURE 9.

The development of IBD and progression of prolapse between Ogr1−/−/IL-10−/−and Ogr1+/+/Il-10−/− female mice. A, Comparison of MPO activity in colon tissue (B). Assessment of colon length. C, Relative spleen weight. Asterisks denote significant differences from the respective control (*P < 0.05, **P < 0.01).
