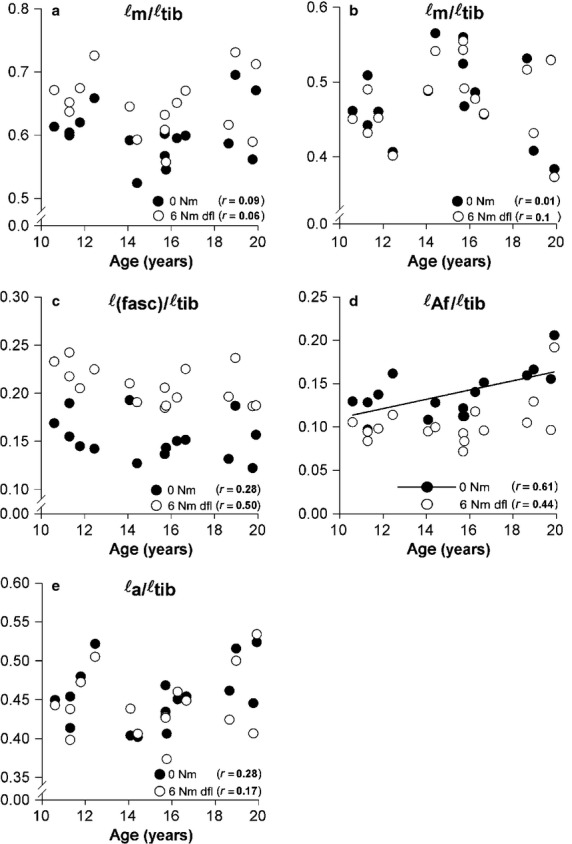
Fig 6.

Effect of age on GM geometry normalised for tibia length at induced footplate angles corresponding to neutral (0 Nm) and 6 Nm dorsal flexion. A linear regression line is plotted if a significant age effect is present, otherwise there was no regression line present. (a) Normalised muscle belly length (ℓm/ℓtib). (b) Normalised tendon length (ℓt/ℓtib). (c) Normalised fascicle length [ℓ(fasc)/ℓtib]. (d) Normalised length component of physiological cross-sectional area (ℓAf/ℓtib). (e) Normalised aponeurosis length (ℓa/ℓtib). Statistical analysis with GEE indicated that after normalisation only the normalised length component of the physiological cross-sectional area changed with age. Thus, tibia length cannot fully explain changes in ℓAf.
