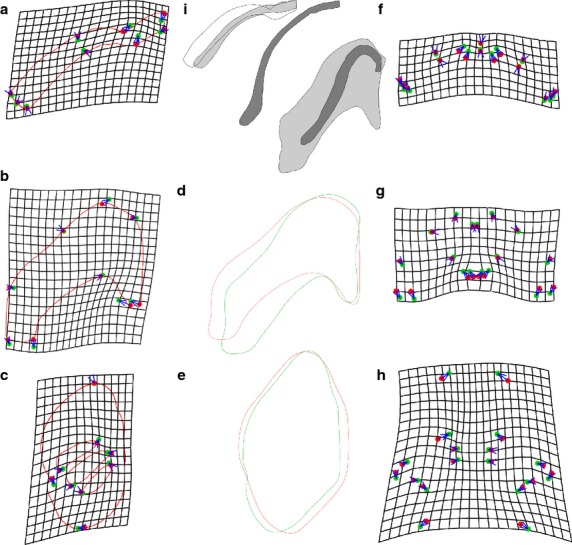
Fig 4.

TPSA deformation grids, average contours and representative outlines for the lower jaw (LJ), ceratohyal (CH) and branchial arch (BA) cartilages in tadpoles and metamorphs. (a–c) Grids showing deformation of landmarks from NF 46 (red) to 59 (green) average configurations for LJ (a), CH (b) and BA (c). (d,e) elliptic Fourier-generated average shapes for CH (d) and BA (e) at NF 46 (red) and 59 (green). (f-h), same as (a-c) but with left and right shapes analyzed separately to show changes in orientation of cartilages. (i) outlines of representative LJ and CH shapes at NF 46 (no stipple), 59 (light stipple) and 66 (dark stipple). The NF 46 LJ is drawn with the same anterior-posterior dimension as the NF 59 LJ; the NF 59 and 66 LJ and CH are from a pair of specimens with the same size at NF 59.
