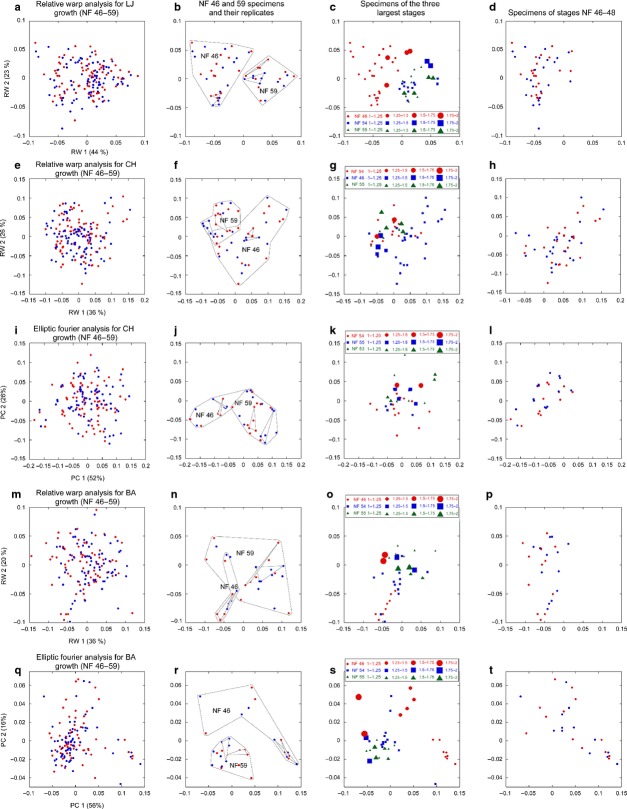
Fig 5.
Scatterplots of first and second principal component scores from RWA and EFA of the lower jaw (LJ), ceratohyal (CH) and branchial arch (BA) cartilages in tadpoles. (a–d) RWA of LJ, (e–h) RWA of CH, (i–l) EFA of CH, (m–p) RWA of BA, (q–t) EFA of BA. (a, e, i, m and q) Scores for all left (red) and right (blue) cartilages at NF 46–59 (percentages in parentheses indicate variation explained by each component). (b, f, j, n and r) Scores for only the NF 46 and 59 cartilages (larger groups) including the NF 46 and 59 replicates (smaller groups). (c, g, k, o and s) Scores for only the three stages with the largest relative size ranges (symbol sizes indicate sizes of cartilages relative to the smallest cartilage at each stage). (d, h, l, p and t) Scores for only the NF 46–48 cartilages.

