
FIGURE 5.
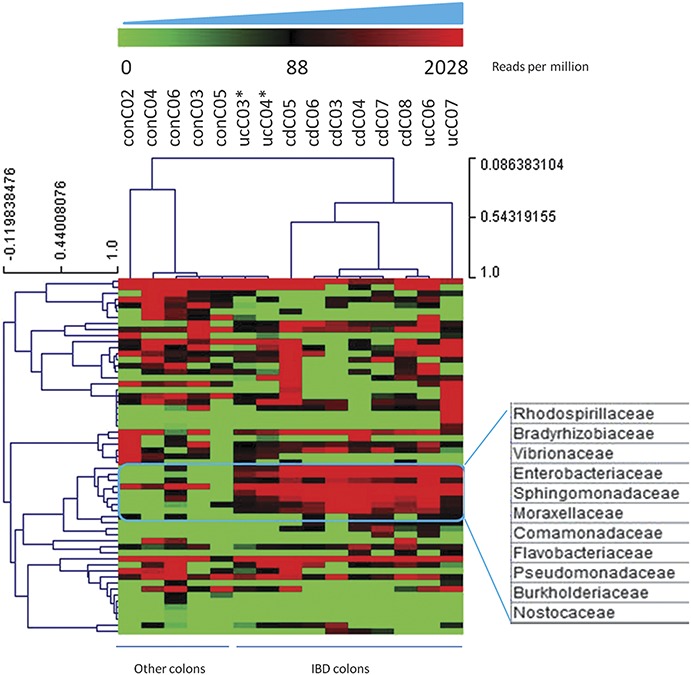
Hierarchical clustering of bacterial data sets based on transcripts per million (per sample counts ranging from 0 to about 2000). Clusters were identified from the bacterial profiling patterns on a per-bacterial-family (rows with distance values ranging from −0.12 to 1) and a per-sample (columns with distance values ranging from 0.08 to 1) basis. Most of the IBD samples clustered together except 2 UC colon samples marked with asterisks (ucC03 and ucC04 with limited viral sequences/diversity). Cluster of bacteria expressed at consistently higher levels in IBD samples as strongly associated with IBD in previous publications.