
Figure 5.
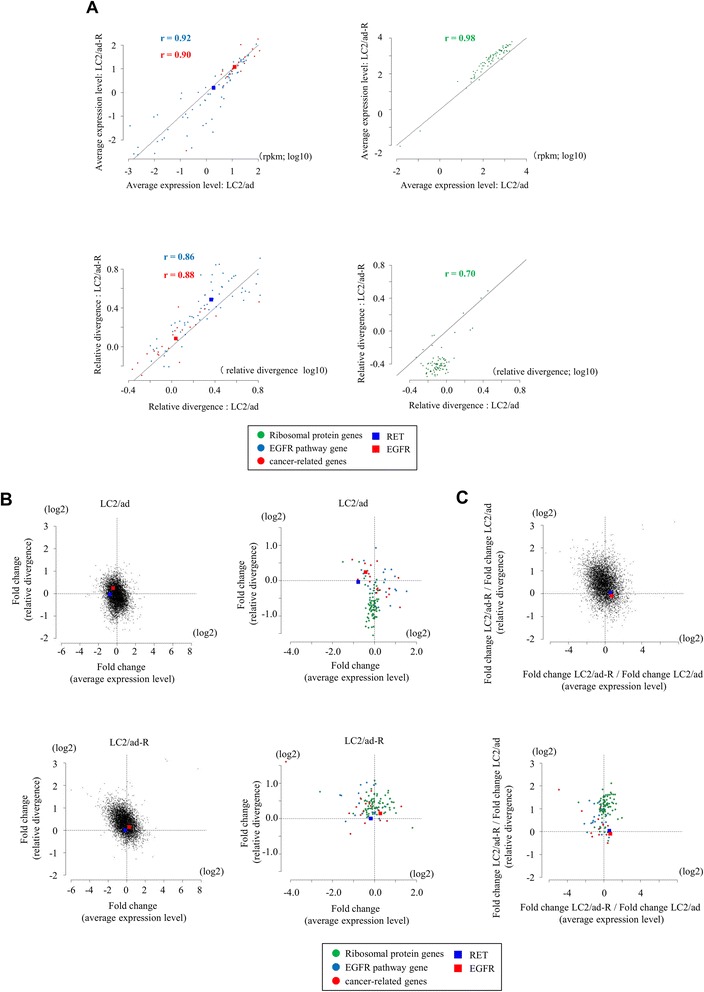
Expression changes in response to anti-cancer drug stimulation. (A) Correlation of the average expression levels and the relative divergences between LC2/ad and LC2/ad-R cells for EGFR pathway genes (blue), caner-related genes (red) and ribosomal protein genes (green). Pearson’s correlation coefficients are shown in the plots. The plots of the EGFR and RET genes are highlighted by red and blue boxes, respectively. (B) Gene expression changes in response to vandetanib treatment in LC2/ad (upper panel) and LC2/ad-R (lower panel) cells. Each gene, plots show fold changes in the average expression levels (x-axis) and the relative divergence. The dotted lines represent the values that were unchanged (fold = 1). Right panels show plots for ribosomal protein genes, the EGFR pathway genes and the cancer-related genes. The color key is as in (A). (C) Relative fold changes in average expression levels (x-axis) and relative divergences (y-axis) for LC2/ad and LC2/ad-R cells. The dotted lines indicate the values that were unchanged between these cell lines. The lower panel shows ribosomal protein genes, the EGFR pathway genes and the cancer-related genes. The color key is as in (A).