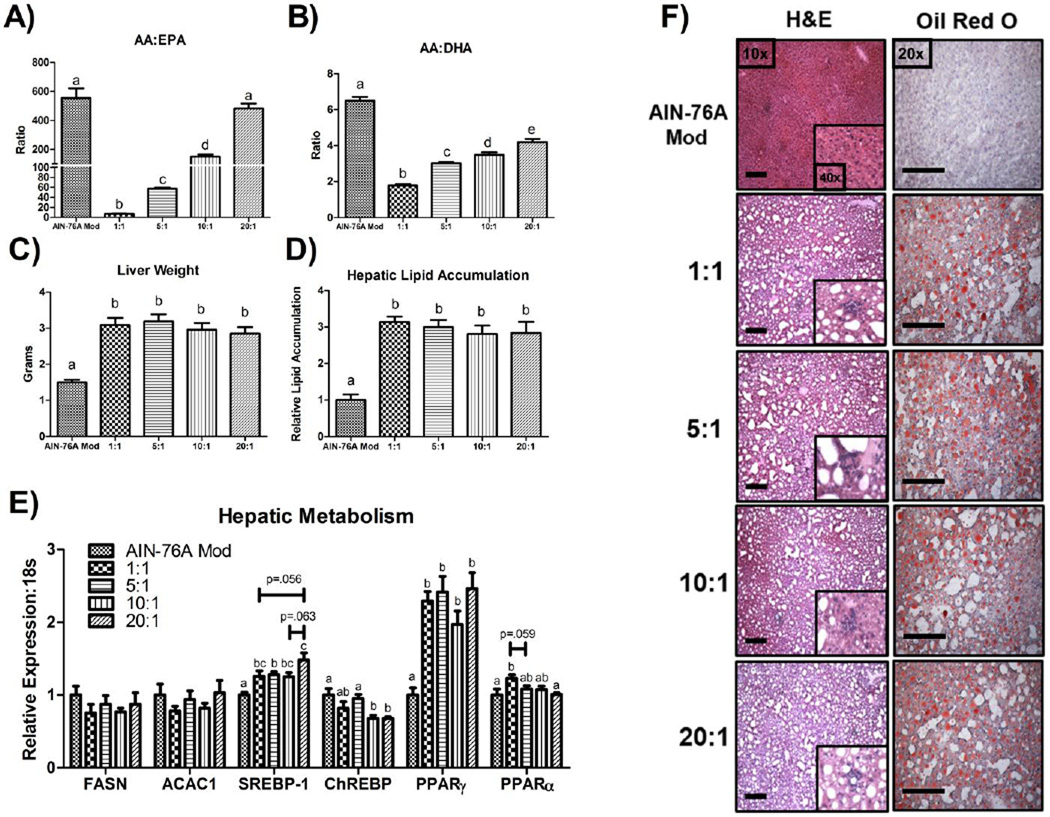
Figure 1.
Impact of dietary n-6:n-3 on murine NAFLD development. (A) AA:EPA, and (B) AA:DHA in hepatic phospholipids, (C) liver weight, (D) hepatic lipid accumulation, (E) hepatic mRNA expression of metabolism-related genes, as well as (F) representative hepatic H&E (10x & 40x) and oil red O images (20x) displaying steatosis and inflammatory infiltrate (n=10/group). Scale bars represent 200 µm. Treatment groups included a control diet (AIN-76A Mod) and four HFDs differing in the n-6:n-3 (1:1, 5:1, 10:1, and 20:1) consumed for a 20-week period. Diets not sharing a common letter differ significantly from one another (P≤.05). Data are presented as means (±SEM).

