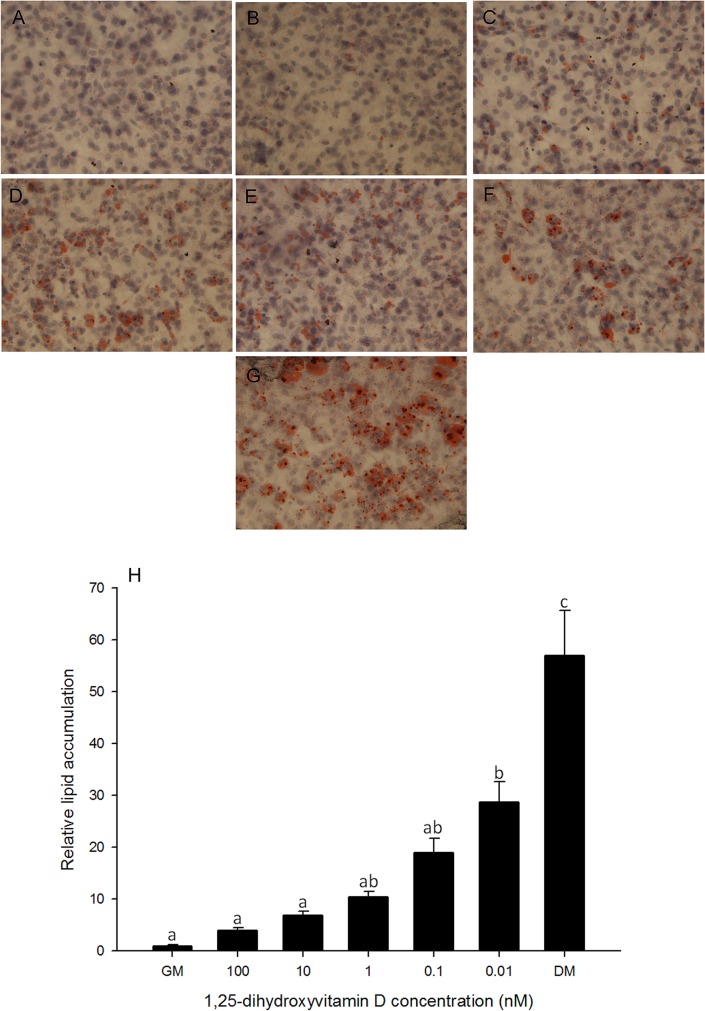
Fig 1. Oil Red O staining in 3T3-L1 cells.
Cells were treated with basal growth medium (GM) (A) or differentiation medium plus different concentrations of 1, 25 - (OH)2D3, 100 nM (B), 10 nM (C), 1 nM (D), 0.1 nM (E) or 0.01 nM (F) or differentiation medium (DM) (G). Oil Red O staining was performed on days 2, 4, 6, 8 and 10. Representative day 10 images are shown. Images were collected at 400x magnification. (H): Quantification of lipid accumulation in 3T3-L1 cells. Lipid accumulation was quantified using MetaMorph Image analysis software. Area fractions were collected for each treatment and normalized to control of corresponding time point. Data are means ± SE (n = 3). Different letters represent treatment effects that were significantly different (P < 0.05). The dose-response effect of 1, 25 - (OH)2D3 treatment on lipid accumulation is illustrated.

