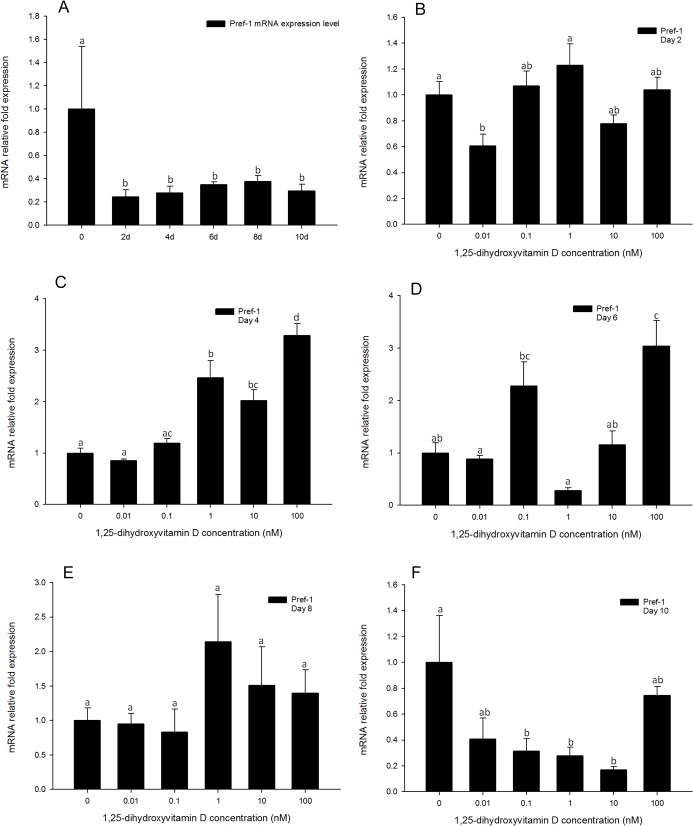
Fig 12. Real-time PCR quantification of Pref-1 gene expression in 3T3-L1 cells (A): in the positive control treatment (DM) on days 0, 1, 2, 4, 6, 8, and 10 (B to F).
Cells were treated with DM in the presence or absence of 0.01, 0.1, 1, 10, and 100 nM 1, 25 - (OH)2D3 and EEF2 was used as endogenous control (∆Ct). Data were normalized to Pref-1 gene expression of the positive control (DM) at the corresponding time point (∆∆Ct). (B) day 2, (C) day 4 (D) day 6, (E) day 8 and (F) day 10. Data are means ± SE (n = 3). Different letters represent treatment effects that were significantly different (P < 0.05).

