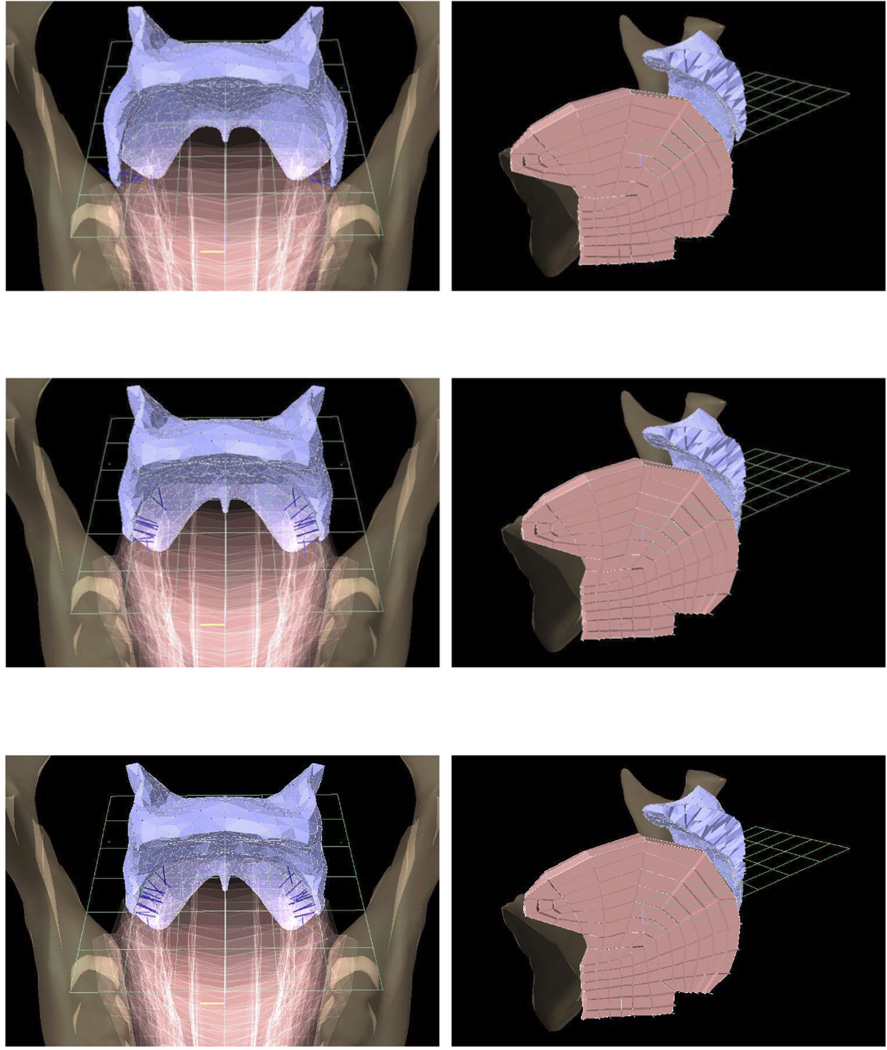
Figure 4.
Effect of the PG muscle (anterior + posterior) on OPI constriction, shown in anterior bird’s-eye view (left column) and midsagittal cutaway view (right column). The images in (a) (top row) are taken immediately before muscle activation, (b) (middle row) shows the mid-point of the movement, and (c) (bottom row) is taken at the end of muscle activation. Short, dark blue line segments along the tongue edge indicate normal vectors at contact points between the tongue and soft palate. The grid visible in these images intersects the model through the measurement plane used to measure OPI area; grid squares are 1 cm2.

