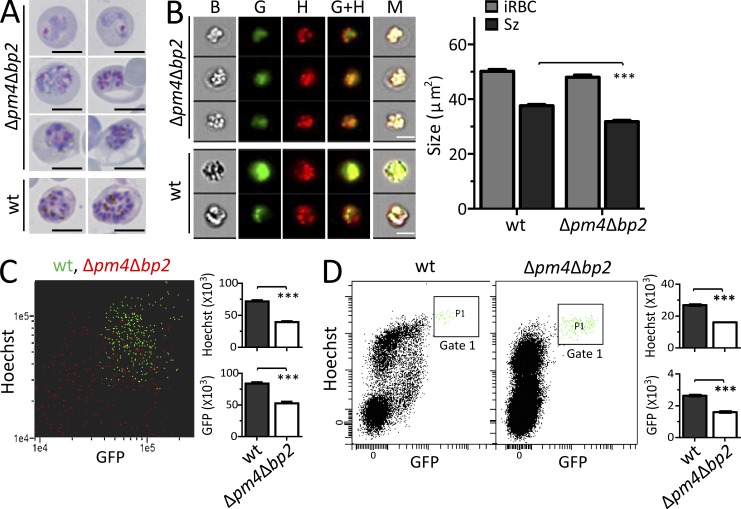
Figure 2.
Szs of mutants lacking PM4 and BP2 expression are smaller in size and produce fewer merozoites. (A) Representative Giemsa-stained images showing the difference in size and merozoites production of Δpm4Δbp2 iRBCs relative to WT. Bars, 5 µm. (B) Images of Hoechst stained mature WT and Δpm4Δbp2 Szs expressing GFP under Sz-specific ama1 promoter in their cytoplasm (right) and their size measurement by ImageStream flow cytometry (left). Bars, 5 µm. The size of individual iRBC was determined from bright field images (B) and the size of Sz was measured from the combined GFP (G) and Hoechst (H) images (i.e., G+H). M, merged images (n > 250; ***, P < 0.0001; Student’s t test). (C) The dot plot (left) generated from ImageStream flow cytometry shows the GFP- and Hoechst-fluorescence of individual WT- (green) and Δpm4Δbp2- (red) Sz, and the GFP expression and DNA content were quantified (right). (D) The GFP and DNA content of mature Szs were measured by standard flow cytometry; mature Szs were selected in Gate 1 (left) and the quantification shown as bar graphs (right). All data are representative of two independent experiments (bar graphs show mean fluorescence intensity with SEM; ***, P < 0.0001; Student’s t test).

