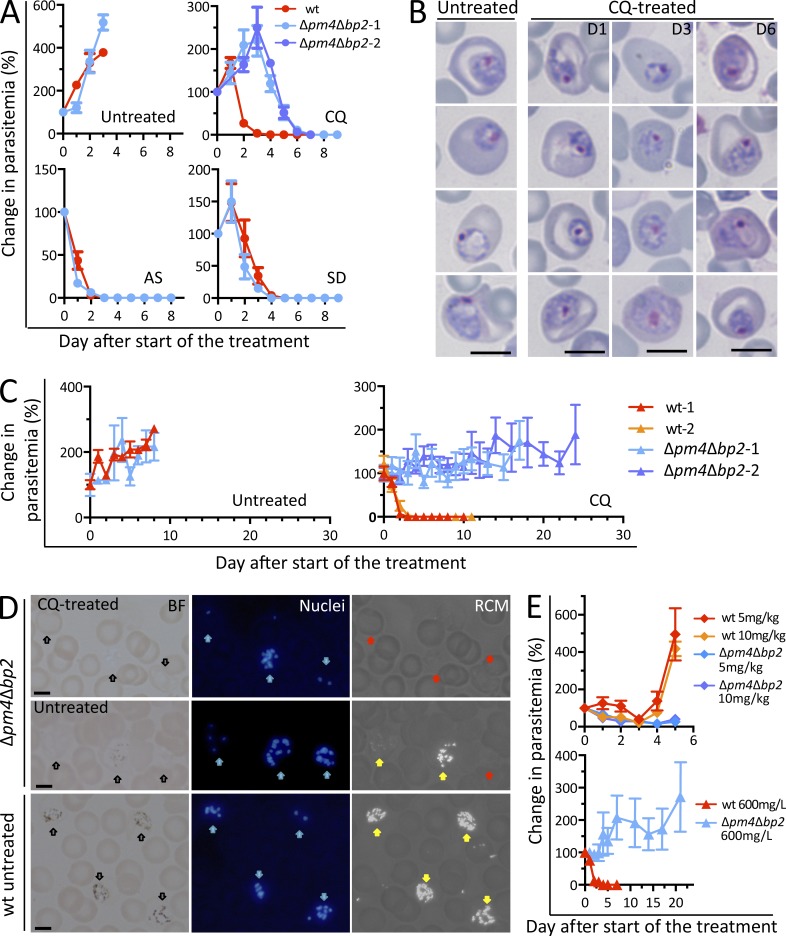
Figure 5.
Δpm4Δbp2 parasites are resistant to chloroquine but sensitive to artesunate. (A) Changes in parasitemia of BALB/c mice (n = 5) infected with WT or Δpm4Δbp2 parasites after treatment with chloroquine (CQ; 288mg/liter in drinking water; 2 experiments), artesunate (AS; 50 mg/kg body weight i.p), or sulfadiazine (SD; 35 mg/liter in drinking water). Data presented as mean with SEM. (B) Representative Giemsa-stained images of pm4Δbp2-Tzs in blood of BALB/c mice treated with CQ treatment at different days (D1, 3, 6) after start of CQ treatment. Bars, 5 µm. (C) Changes in parasitemia of Rag2−/−γc−/− (n = 6) mice infected with WT or Δpm4Δbp2 parasites either without treatment (left) or after prolonged CQ treatment (right; 288 mg/l in drinking water; 2 experiments). (D) Reflection contrast polarized light microscopy images (RCM) showing the absence of Hz crystals in Δpm4Δbp2 parasites that survived CQ treatment for >20 d in Rag2−/−γc−/− mice; iRBC with no Hz formation are indicated by red arrows. In untreated mice, two populations of Δpm4Δbp2 parasites are present, parasites with no Hz (red arrow), and parasites with Hz crystals (yellow arrows). WT parasites in untreated mice show large amounts of Hz (yellow arrows). Black arrows indicate iRBC in bright field (BF) images. Nuclei of parasites (blue) were stained with Hoechst (blue arrows). Bars, 5 µm. (E) Changes in parasitemia of BALB/c mice (top, n = 5) or Rag2−/−γc−/− mice (bottom, n = 5) infected with Δpm4Δbp2 and WT parasites exposed to either 5 or 10 mg/kg of AS in or to 600 mg/l CQ in drinking water. Data presented as mean values of changes (%) in parasitemia with SEM.

