Figure 2.
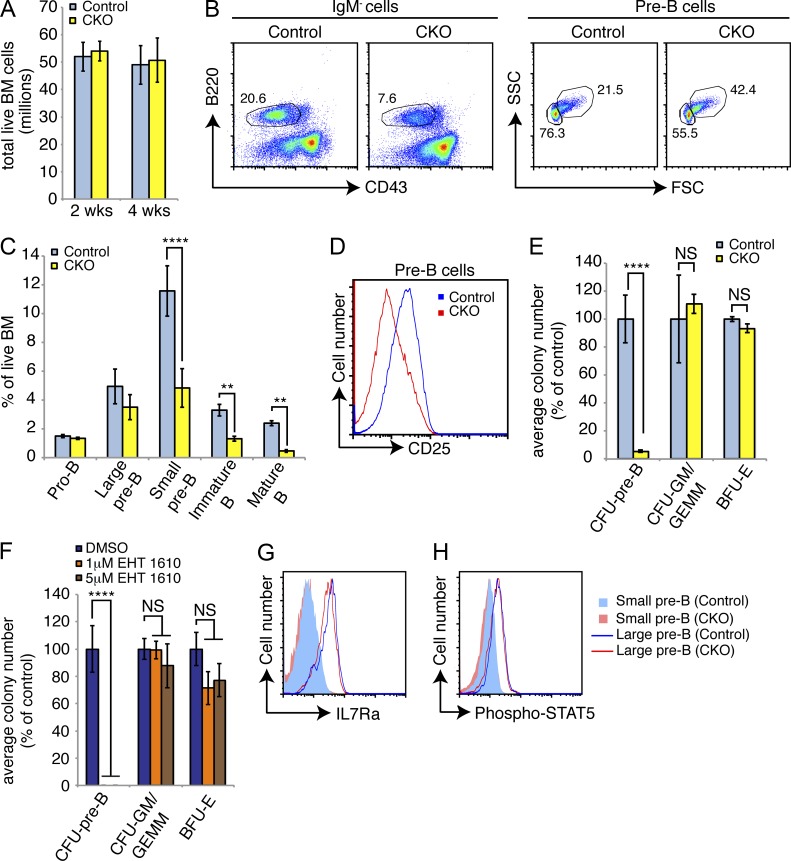
Loss of Dyrk1a adversely affects B cell development. (A) Mean bone marrow cellularity was assessed in Dyrk1af/f Mx1-Cre− (Control) and Dyrk1af/f Mx1-Cre+ (CKO) mice 2 and 4 wk after pI:pC treatment; n = 6 mice per genotype, pooled from 3 independent cohorts of 2 mice per genotype. (B) Representative flow cytometry analysis of bone marrow for total pre–B (IgM− gate, left) and large/small pre–B (pre–B gate, right) cells 4 wk after pI:pC treatment is shown. Numbers indicate percentages in each gate; mean percentages of each population among total bone marrow cells were quantified in (C); n = 6 mice per genotype, pooled from 3 independent cohorts of 2 mice per genotype. (D) Representative flow cytometry analysis of pre–B cell surface CD25 expression in bone marrow from Control and CKO mice 2 wk after pI:pC treatment is shown; n = 6 mice per genotype, pooled from 3 independent cohorts of 2 mice per genotype. (E) Mean number of colony forming units from total bone marrow 2 wk after pI:pC treatment as percent of Control for each colony type was calculated; n = 3 mice per genotype, with duplicate plates for each mouse. Data are representative of three independent experiments. (F) The mean numbers and phenotypes of colonies formed by WT bone marrow in the presence of indicated concentrations of EHT 1610 were calculated. Results depict duplicate plates for each condition, and represent 3 independent experiments. (G) Surface IL7R-α expression (H) and intracellular STAT5 phosphorylation (Y694, C) in small and large pre–B cells from the bone marrow of Control and CKO mice 2 wk after pI:pC treatment were assessed by flow cytometry. Data are representative of 3three mice per genotype. For all graphs, error bars depict SD. **, P < 0.01; ****, P < 0.0001.

